Reduced responsiveness is an essential feature of chronic fatigue syndrome: a fMRI study - PubMed (original) (raw)
Reduced responsiveness is an essential feature of chronic fatigue syndrome: a fMRI study
Masaaki Tanaka et al. BMC Neurol. 2006.
Abstract
Background: Although the neural mechanism of chronic fatigue syndrome has been investigated by a number of researchers, it remains poorly understood.
Methods: Using functional magnetic resonance imaging, we studied brain responsiveness in 6 male chronic fatigue syndrome patients and in 7 age-matched male healthy volunteers. Responsiveness of auditory cortices to transient, short-lived, noise reduction was measured while subjects performed a fatigue-inducing continual visual search task.
Results: Responsiveness of the task-dependent brain regions was decreased after the fatigue-inducing task in the normal and chronic fatigue syndrome subjects and the decrement of the responsiveness was equivalent between the 2 groups. In contrast, during the fatigue-inducing period, although responsiveness of auditory cortices remained constant in the normal subjects, it was attenuated in the chronic fatigue syndrome patients. In addition, the rate of this attenuation was positively correlated with the subjective sensation of fatigue as measured using a fatigue visual analogue scale, immediately before the magnetic resonance imaging session.
Conclusion: Chronic fatigue syndrome may be characterised by attenuation of the responsiveness to stimuli not directly related to the fatigue-inducing task.
Figures
Figure 1
Time course of the stimulus display sequence of the task trials. For present and absent trials, a randomly selected digit from 20 to 99 was presented on the centre of the viewing screen for 500 ms, followed by a test sequence of digits (targets) presented for 3,500 ms. In a given trial, subjects judged whether the digit first presented was among the targets. If they believed the presented target digit matched the first digit, subjects pressed the left button (present trial); if not, they pressed the right button (absent trial). There was no time interval between trials. For the null trial, the word "NULL" was presented on the centre of the viewing screen for 500 ms, followed by a test sequence presented for 3,500 ms. Subjects judged whether there was a black circle among the white circles. When a black circle was present among the white ones, subjects pressed the left button; and when all of the circles were white, they pressed the right button. There was no time interval between the trials.
Figure 2
Experimental procedure. Experiment included 3 sessions: Pre-fatigue, fatigue, and post-fatigue sessions. Subjects performed pre-fatigue, fatigue, and post-fatigue sessions lying on the MRI scanner table with both ears plugged. The time interval between 2 successive sessions was 1 min. For the fatigue session (fatigue-inducing period), normal subjects performed visual search trials (present or absent trials) for 1 hour, while CFS patients performed visual search trials for 30 min. During this period, continual visual search trials were performed; null trials were not included. In the pre- or post-fatigue sessions, subjects performed visual search or null trials for 6 min.
Figure 3
Subjective and behavioural results. (A) Results of subjective fatigue sensation. Just before (Before) and after (After) the fMRI experiments, subjects were asked to rate subjective sensation of fatigue on the visual analogue scale (VAS) from 0 to 10. (B-DS) Behavioural results. In the pre- (Pre) or post-fatigue (Post) sessions, subjects performed visual search or null trials for 6 min. During these sessions, percentage of the response within 3.5 sec (B), accuracy (C), and reaction time (D) were recorded. Closed columns, normal subjects; open columns, CFS subjects. **P < 0.01, significant difference; ns, no significant difference (paired t-test). Data are mean and SEM.
Figure 4
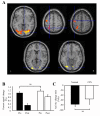
Activity related to visual search. (A) Statistical parametric maps activated by visual search (random-effect analysis of 13 subjects, P < 0.05, corrected). In order to identify brain regions activated by visual search, we calculated percent signal change evoked during present and absent trials as compared with that for null trial. Anatomical locations were mapped on axial template brains. Top: Sections passing through visual cortices (left), intraparietal sulcus (middle), and precentral gyrus (right) in the pre-fatigue session. Bottom: Sections passing through right visual cortex (left) and left visual cortex (right) in the post-fatigue session. Crossing line indicates the local activity maximum of each brain region. The right (R) and left (L) sides are indicated. (B) Activity in the visual cortices during the visual search in the pre- (Pre) and post-fatigue (Post) sessions of the normal and CFS patient groups. Magnitude of the activity was calculated as the peak signal change (%) averaged across the activated areas. (C) Activity change rate in the visual cortices during the visual search of the normal and CFS patient groups. Activity change rate (%/h) was calculated as change of activity in the visual cortices during the visual search from pre-fatigue to post-fatigue sessions divided by the session time (hour) of the fatigue-inducing period × 100. Data are mean and SEM. ns, no significant difference (unpaired t-test). Closed columns, normal subjects; open columns, CFS subjects.
Figure 5
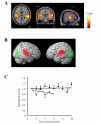
Activity related to transient reduction of fMRI acquisition noise. (A) Statistical parametric maps activated by noise reduction in the pre-fatigue session (random-effect analysis, P < 0.05, corrected). Anatomical locations were mapped on template brains. Axial (left), coronal (middle), and sagittal (left) sections passing through auditory cortices are shown. Crossing line indicates the local activity maximum of the brain regions. The right (R) and left (L) sides are indicated. (B) Statistical parametric maps activated by fMRI noise reduction (red) and visual search (green) in the pre-fatigue session (random effect analysis, P < 0.05, corrected). Combined statistical parametric maps were superimposed on surface-rendered high-resolution MRIs viewed from right and left. (C) Time course of normalised activity in the auditory cortices during fatigue-inducing period in the normal and CFS patient groups. To evaluate the time course of the auditory responses, we divided the fatigue-inducing period into 6-min sections, and measured activity of the brain regions that had been activated by transient reduction of fMRI noise in the pre-fatigue session. Magnitude of the activity was calculated as the peak signal change (%) averaged across the activated areas. Normalised activity was calculated as activity in a given section divided by that in the first section. Data are mean and SEM. Closed circles, normal subjects; open circles, CFS subjects.
Figure 6
Activity related to noise reduction by regression analyses. Brain regions in which responsiveness to transient noise reduction was decreased in the CFS patients (A), and those in which responsiveness to transient noise reduction was decreased in the CFS patients relative to the normal subjects (B) during the fatigue session over 30 min (P < 0.05, uncorrected) are shown. Brain regions shown in Figure 6A and B are limited within auditory cortices. Anatomical locations were mapped on coronal template brains, with coordinate in mm from the anterior commissure. The left side (L) is indicated. (C) Time course of 10-event moving-averaged normalised peak activity of the left planum temporale. Normalised peak activity was calculated as shown in 'Materials and Methods' section. Linear regression lines are shown. Closed circles, normal subjects; open circles, CFS subjects. Data are mean and SEM.
Figure 7
Subjective-activity correlations. Subjective scale correlations for the signal changes of the visual (A, B) and auditory (C, D) cortices are shown. Activity change rate or normalised activity change ratio were plotted against pre-experiment visual analogue scale score (pre-experiment VAS) (A, C) or change rate of visual analogue scale score after the experiment (ΔVAS) (B, D). Activity change rate was calculated as change of activity of the visual cortices during the visual search from pre-fatigue to post-fatigue sessions divided by the session time (hour) of the fatigue-inducing period. Normalised activity was calculated as activity of the auditory cortices in a given section divided by that in the first section. Normalised activity change ratio was calculated from the slope of regression fitted to a scatter plot of the time course (section) against normalised activity. Subjects were asked to rate subjective sensation of fatigue on the VAS from 0 to 10. Squared Pearson correlation (R2) and P value are displayed. Closed circles, normal subjects; open circles, CFS subjects.
Similar articles
- Neural effects of prolonged mental fatigue: a magnetoencephalography study.
Ishii A, Tanaka M, Shigihara Y, Kanai E, Funakura M, Watanabe Y. Ishii A, et al. Brain Res. 2013 Sep 5;1529:105-12. doi: 10.1016/j.brainres.2013.07.022. Epub 2013 Jul 20. Brain Res. 2013. PMID: 23880373 Clinical Trial. - Objective evidence of cognitive complaints in Chronic Fatigue Syndrome: a BOLD fMRI study of verbal working memory.
Lange G, Steffener J, Cook DB, Bly BM, Christodoulou C, Liu WC, Deluca J, Natelson BH. Lange G, et al. Neuroimage. 2005 Jun;26(2):513-24. doi: 10.1016/j.neuroimage.2005.02.011. Epub 2005 Apr 7. Neuroimage. 2005. PMID: 15907308 Clinical Trial. - Neural correlates of the chronic fatigue syndrome--an fMRI study.
de Lange FP, Kalkman JS, Bleijenberg G, Hagoort P, van der Werf SP, van der Meer JW, Toni I. de Lange FP, et al. Brain. 2004 Sep;127(Pt 9):1948-57. doi: 10.1093/brain/awh225. Epub 2004 Jul 7. Brain. 2004. PMID: 15240435 - The neural correlates of fatigue: an exploratory imaginal fatigue provocation study in chronic fatigue syndrome.
Caseras X, Mataix-Cols D, Rimes KA, Giampietro V, Brammer M, Zelaya F, Chalder T, Godfrey E. Caseras X, et al. Psychol Med. 2008 Jul;38(7):941-51. doi: 10.1017/S0033291708003450. Epub 2008 Apr 30. Psychol Med. 2008. PMID: 18447963 - Probing the working memory system in chronic fatigue syndrome: a functional magnetic resonance imaging study using the n-back task.
Caseras X, Mataix-Cols D, Giampietro V, Rimes KA, Brammer M, Zelaya F, Chalder T, Godfrey EL. Caseras X, et al. Psychosom Med. 2006 Nov-Dec;68(6):947-55. doi: 10.1097/01.psy.0000242770.50979.5f. Epub 2006 Nov 1. Psychosom Med. 2006. PMID: 17079703
Cited by
- Myalgic Encephalomyelitis/Chronic Fatigue Syndrome (ME/CFS) and Comorbidities: Linked by Vascular Pathomechanisms and Vasoactive Mediators?
Wirth KJ, Löhn M. Wirth KJ, et al. Medicina (Kaunas). 2023 May 18;59(5):978. doi: 10.3390/medicina59050978. Medicina (Kaunas). 2023. PMID: 37241210 Free PMC article. - Visual fatigue caused by watching 3DTV: an fMRI study.
Chen C, Wang J, Li K, Liu Y, Chen X. Chen C, et al. Biomed Eng Online. 2015;14 Suppl 1(Suppl 1):S12. doi: 10.1186/1475-925X-14-S1-S12. Epub 2015 Jan 9. Biomed Eng Online. 2015. PMID: 25603496 Free PMC article. - A systematic review of chronic fatigue syndrome: don't assume it's depression.
Griffith JP, Zarrouf FA. Griffith JP, et al. Prim Care Companion J Clin Psychiatry. 2008;10(2):120-8. doi: 10.4088/pcc.v10n0206. Prim Care Companion J Clin Psychiatry. 2008. PMID: 18458765 Free PMC article. - Abnormal Resting-State Functional Connectivity in Patients with Chronic Fatigue Syndrome: Results of Seed and Data-Driven Analyses.
Gay CW, Robinson ME, Lai S, O'Shea A, Craggs JG, Price DD, Staud R. Gay CW, et al. Brain Connect. 2016 Feb;6(1):48-56. doi: 10.1089/brain.2015.0366. Epub 2015 Nov 10. Brain Connect. 2016. PMID: 26449441 Free PMC article. - Coordination between heart rate variability and physical activity may be diminished by fatigability in non-older women in the hour before sleep.
Taniguchi K, Shimouchi A, Jinno N, Seiyama A. Taniguchi K, et al. Physiol Rep. 2021 Nov;9(22):e15126. doi: 10.14814/phy2.15126. Physiol Rep. 2021. PMID: 34826217 Free PMC article.
References
- Fukuda K, Straus SE, Hickie I, Sharpe MC, Dobbins JG, Komaroff A. The chronic fatigue syndrome: a comprehensive approach to its definition and study. International Chronic Fatigue Syndrome Study Group. Ann Intern Med. 1994;121:953–959. - PubMed
- Altay HT, Toner BB, Brooker H, Abbey SE, Salit IE, Garfinkel PE. The neuropsychological dimensions of postinfectious neuromyasthenia (chronic fatigue syndrome): a preliminary report. Int J Psychiatry Med. 1990;20:141–149. - PubMed
Publication types
MeSH terms
LinkOut - more resources
Full Text Sources
Medical


