Characteristics and clustering of human ribosomal protein genes - PubMed (original) (raw)
Characteristics and clustering of human ribosomal protein genes
Kyota Ishii et al. BMC Genomics. 2006.
Abstract
Background: The ribosome is a central player in the translation system, which in mammals consists of four RNA species and 79 ribosomal proteins (RPs). The control mechanisms of gene expression and the functions of RPs are believed to be identical. Most RP genes have common promoters and were therefore assumed to have a unified gene expression control mechanism.
Results: We systematically analyzed the homogeneity and heterogeneity of RP genes on the basis of their expression profiles, promoter structures, encoded amino acid compositions, and codon compositions. The results revealed that (1) most RP genes are coordinately expressed at the mRNA level, with higher signals in the spleen, lymph node dissection (LND), and fetal brain. However, 17 genes, including the P protein genes (RPLP0, RPLP1, RPLP2), are expressed in a tissue-specific manner. (2) Most promoters have GC boxes and possible binding sites for nuclear respiratory factor 2, Yin and Yang 1, and/or activator protein 1. However, they do not have canonical TATA boxes. (3) Analysis of the amino acid composition of the encoded proteins indicated a high lysine and arginine content. (4) The major RP genes exhibit a characteristic synonymous codon composition with high rates of G or C in the third-codon position and a high content of AAG, CAG, ATC, GAG, CAC, and CTG.
Conclusion: Eleven of the RP genes are still identified as being unique and did not exhibit at least some of the above characteristics, indicating that they may have unknown functions not present in other RP genes. Furthermore, we found sequences conserved between human and mouse genes around the transcription start sites and in the intronic regions. This study suggests certain overall trends and characteristic features of human RP genes.
Figures
Figure 1
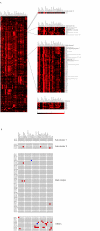
Expression profiles of human ribosomal protein (RP) genes in 30 tissues. (A) Hierarchical clustering of tissue expression profile using a centroid linkage algorithm. Black regions represent low gene expression level for that gene (row) in the tissue (column), whereas the red regions represent high gene expression level. The genes in the Main cluster, Sub-cluster 1, and Sub-cluster 2 show a correlation coefficient value of 0.94, 0.98 and 0.75, respectively.(B) Detection of differentially expressed RP genes by Grubbs' outlier test. Red regions represent genes (row) expressed at significantly higher rates in a certain tissue (column) than any other RP gene. Blue regions represent genes expressed at significantly lower rates than any other RP gene. A P value <0.05 was considered significant.
Figure 2
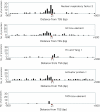
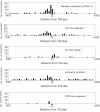
Transcription factor binding sites predicted by phylogenetic footprinting. The distance from the TSS (bp) is shown on the X axis, and the identity (%) with the orthologous mouse gene is shown on the Y axis. Black boxes indicate exons. Each thin line represents a location of a predicted promoter (NRF: nuclear respiratory factor 2; YY: Yin and Yang 1; GC: GC boxes; AP: activator protein 1; TA: TATA boxes).
Figure 3
Distribution of predicted transcription factor binding sites. The distance from the TSS (bp) is shown on the X axis, and the number of predicted transcription factor binding sites is shown on the Y axis. The red triangle depicts TSS (+1).
Figure 4
Hierarchical clustering of ribosomal protein (RP) genes by amino acid composition. The black regions represent low frequencies of encoding of the amino acid (column) by that gene (row) whereas the red regions represent high frequencies of encoding. (F: Phenylalanine, L: Leucine, I: Isoleucine, M: Methionine, V: Valine, P: Proline, T: Threonine, A: Alanine, Y: Tyrosine, H: Histidine, Q: Glutamine, N: Asparagine, K: Lysine, D: Aspartic acid, E: Glutamic acid, C: Cysteine, W: Tryptophan, R: Arginine, S: Serine, G: Glycine)
Figure 5
Hierarchical clustering of synonymous codon composition. The black regions represent low rates of occurrence of the codon (column) in that gene (row), whereas the red regions represent high rates of occurrence.
Similar articles
- Identification of highly specific localized sequence motifs in human ribosomal protein gene promoters.
Roepcke S, Zhi D, Vingron M, Arndt PF. Roepcke S, et al. Gene. 2006 Jan 3;365:48-56. doi: 10.1016/j.gene.2005.09.033. Epub 2005 Dec 15. Gene. 2006. PMID: 16343812 - The complete set of Toxoplasma gondii ribosomal protein genes contains two conserved promoter elements.
Van Poppel NF, Welagen J, Vermeulen AN, Schaap D. Van Poppel NF, et al. Parasitology. 2006 Jul;133(Pt 1):19-31. doi: 10.1017/S0031182006009954. Epub 2006 May 4. Parasitology. 2006. PMID: 16674839 - Bone marrow cells from patients with Shwachman-Diamond syndrome abnormally express genes involved in ribosome biogenesis and RNA processing.
Rujkijyanont P, Adams SL, Beyene J, Dror Y. Rujkijyanont P, et al. Br J Haematol. 2009 Jun;145(6):806-15. doi: 10.1111/j.1365-2141.2009.07692.x. Epub 2009 May 6. Br J Haematol. 2009. PMID: 19438500 - Optimizing scaleup yield for protein production: Computationally Optimized DNA Assembly (CODA) and Translation Engineering.
Hatfield GW, Roth DA. Hatfield GW, et al. Biotechnol Annu Rev. 2007;13:27-42. doi: 10.1016/S1387-2656(07)13002-7. Biotechnol Annu Rev. 2007. PMID: 17875472 Review. - Coordinate expression of ribosomal protein genes in yeast as a function of cellular growth rate.
Mager WH, Planta RJ. Mager WH, et al. Mol Cell Biochem. 1991 May 29-Jun 12;104(1-2):181-7. doi: 10.1007/BF00229818. Mol Cell Biochem. 1991. PMID: 1921998 Review.
Cited by
- Reference genes for proximal femoral epiphysiolysis expression studies in broilers cartilage.
Hul LM, Ibelli AMG, Peixoto JO, Souza MR, Savoldi IR, Marcelino DEP, Tremea M, Ledur MC. Hul LM, et al. PLoS One. 2020 Aug 25;15(8):e0238189. doi: 10.1371/journal.pone.0238189. eCollection 2020. PLoS One. 2020. PMID: 32841273 Free PMC article. - Factors affecting the rapid changes of protein under short-term heat stress.
Wu B, Qiao J, Wang X, Liu M, Xu S, Sun D. Wu B, et al. BMC Genomics. 2021 Apr 13;22(1):263. doi: 10.1186/s12864-021-07560-y. BMC Genomics. 2021. PMID: 33849452 Free PMC article. - NFAT-dependent and -independent exhaustion circuits program maternal CD8 T cell hypofunction in pregnancy.
Lewis EL, Xu R, Beltra JC, Ngiow SF, Cohen J, Telange R, Crane A, Sawinski D, Wherry EJ, Porrett PM. Lewis EL, et al. J Exp Med. 2022 Jan 3;219(1):e20201599. doi: 10.1084/jem.20201599. Epub 2021 Dec 9. J Exp Med. 2022. PMID: 34882194 Free PMC article. - A multilevel gamma-clustering layout algorithm for visualization of biological networks.
Hruz T, Wyss M, Lucas C, Laule O, von Rohr P, Zimmermann P, Bleuler S. Hruz T, et al. Adv Bioinformatics. 2013;2013:920325. doi: 10.1155/2013/920325. Epub 2013 Jun 26. Adv Bioinformatics. 2013. PMID: 23864855 Free PMC article. - Endoplasmic Reticulum Subproteome Analysis Reveals Underlying Defense Mechanisms of Wheat Seedling Leaves under Salt Stress.
Zhang J, Liu D, Zhu D, Liu N, Yan Y. Zhang J, et al. Int J Mol Sci. 2021 May 3;22(9):4840. doi: 10.3390/ijms22094840. Int J Mol Sci. 2021. PMID: 34063651 Free PMC article.
References
- Wool IG. The structure and function of eukaryotic ribosomes. Annu Rev Biochem. 1979;48:719–754. - PubMed
- Ribosomal Protein Gene Database (RPG) http://ribosome.med.miyazaki-u.ac.jp - PubMed
- Reid JL, Iyer VR, Brown PO, Struhl K. Coordinate regulation of yeast ribosomal protein genes is associated with targeted recruitment of Esa1 histone acetylase. Mol Cell. 2000;6:1297–1307. - PubMed
Publication types
MeSH terms
Substances
LinkOut - more resources
Full Text Sources
Research Materials
Miscellaneous


