A class of human exons with predicted distant branch points revealed by analysis of AG dinucleotide exclusion zones - PubMed (original) (raw)
A class of human exons with predicted distant branch points revealed by analysis of AG dinucleotide exclusion zones
Clare Gooding et al. Genome Biol. 2006.
Abstract
Background: The three consensus elements at the 3' end of human introns--the branch point sequence, the polypyrimidine tract, and the 3' splice site AG dinucleotide--are usually closely spaced within the final 40 nucleotides of the intron. However, the branch point sequence and polypyrimidine tract of a few known alternatively spliced exons lie up to 400 nucleotides upstream of the 3' splice site. The extended regions between the distant branch points (dBPs) and their 3' splice site are marked by the absence of other AG dinucleotides. In many cases alternative splicing regulatory elements are located within this region.
Results: We have applied a simple algorithm, based on AG dinucleotide exclusion zones (AGEZ), to a large data set of verified human exons. We found a substantial number of exons with large AGEZs, which represent candidate dBP exons. We verified the importance of the predicted dBPs for splicing of some of these exons. This group of exons exhibits a higher than average prevalence of observed alternative splicing, and many of the exons are in genes with some human disease association.
Conclusion: The group of identified probable dBP exons are interesting first because they are likely to be alternatively spliced. Second, they are expected to be vulnerable to mutations within the entire extended AGEZ. Disruption of splicing of such exons, for example by mutations that lead to insertion of a new AG dinucleotide between the dBP and 3' splice site, could be readily understood even though the causative mutation might be remote from the conventional locations of splice site sequences.
Figures
Figure 1
Sequence arrangement at dBP exons. The locations of several dBPs that have been mapped in vitro are shown, along with the locations of the first and second AG dinucleotides upstream of the 3'ss. In experimentally verified cases of dBP exons the BPS and PPT can be located hundreds of nucleotides upstream of the 3'ss. Because step 2 of splicing in these introns involves a scanning process from the BPS to locate the 3'ss at the first downstream AG, the region between the 3'ss and the BPS is devoid of AG dinucleotides. Upstream of the BPS, AGs appear no longer to be excluded, as indicated by the locations of second AGs upstream of the 3'ss. Here we refer to the region between the 3'ss and the first upstream AG as the AG exclusion zone (AGEZ). BPS, branch point sequence; dBP, distant branch point; PPT, polypyrimidine tract; 3'ss, 3' splice site.
Figure 2
Distribution of dinucleotide exclusion zones. Shown is the distribution of dinucleotide exclusion zones (mod-EZ) upstream of 49,876 human exons (having excluded cases in which the intron was less that 350 nucleotides). Y-axis: log [number of exons]. X-axis: log [size of mod-EZ]. Data are normalized to give a probability density function, which gives the probability that an exon chosen at random will have an exclusion zone of a given size; the area under each curve is 1. Blue lines: first exclusion zone (mod-EZ1), measured from -25 (relative to the 3' splice site) to the first upstream occurrence of the particular dinucleotide (see Materials and methods). Red lines: second exclusion zone (mod-EZ2), measured from -25 relative to the end of the mod-EZ1. AG shows the largest variance between mod-EZ1 and mod-EZ2. Data was sorted into bins of logarithmically increasing widths rendered discrete (bin width 10 at ~100; bin width 100 at ~1,000), with final bin counts divided by bin width and by the total number of exons, followed by application of a three-point averaging filter to produce the given plots. See Materials and methods for full details.
Figure 3
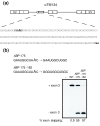
Verifying the exon trapping and mutagenesis approach for identifying distant branch points. The rat α-tropomyosin minigene (TS3St) and a derivative (ΔBP-175), in which the previously determined dBP of exon 3 had been mutated, and an additional mutant (ΔBP-175 -182) were transfected into HeLa cells. Splicing of transiently expressed RNA was analyzed by RT-PCR with a [32P]labeled primer in the PCR reaction. dBP, distant branch point; RT-PCR, reverse transcriptase polymerase chain reaction; WT, wild type.
Figure 4
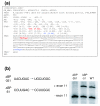
Verification of the predicted dBP of PTB exon 11. (a) Output for PTB exon 11 from our prototype dataset. 'AGEZ' gives the size of the AGEZ; 'AG' gives the positions of three AGs upstream of the 3' splice site and two downstream. -2 is the 3' splice site. 'PPT' and 'U2BP' give the positions of predicted PPT and BPS, with bit scores in square brackets for BPS. 'SEQ1' is the sequence from the third upstream AG to the 3' splice site, whereas 'SEQ2' is the exon sequence to the second downstream AG. Predicted PPTs are in capitals. See Materials and methods for more detailed explanation of terms. Potential BPS that were mutagenized are indicated in red and blue. (b) PTB exon 11 and flanking intron sequences were cloned in an EGFP exon trapping vector [21]. Mutants ΔBP-351 and -51 contained the indicated mutations in potential branch points. Constructs were transfected into HeLa cells, and RNA analyzed by reverse transcriptase polymerase chain reaction. Splicing of exon 11 was abolished in ΔBP-351. AGEZ, AG exclusion zone; BPS, branch point sequence; dBP, distant branch point; PPT, polypyrimidine tract.
Figure 5
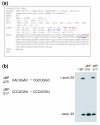
Verification of the predicted dBP of GABBR1 exon 23. (a) Output for GABBR1 exon 23 from our prototype data set. The various field labels are as described in the legend to Figure 4. The two magenta colored Ts are sites of single nucleotide polymorphisms and can be T or C. The potential BPS indicated in bold red and blue were mutagenized. (b) GABBR1 exon 23 and flanking intron sequences were cloned in the EGFP exon trapping vector [21]. Mutants ΔBP-275 and -217 contained the indicated mutations in potential branch points. Constructs were transfected into HeLa cells, and RNA analyzed by reverse transcriptase polymerase chain reaction. Splicing of exon 23 was abolished in ΔBP-275.
Figure 6
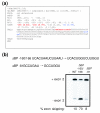
Verification of the predicted dBP of IDB1088375 exon 2. (a) Output from our prototype data set. The various field labels are as described in the legend to Figure 4. The potential BPS indicated in bold red and blue were mutagenized. (b) IDB1088375 exon 2 and flanking intron sequences were cloned in the EGFP exon trapping vector [21]. Mutants ΔBP-160/-166 and -81 contained the indicated mutations in potential branch points. Constructs were transfected into HeLa cells, and RNA analyzed by reverse transcriptase polymerase chain reaction. Splicing of exon 2 was reduced in ΔBP-160/-166, but not in -81.
Figure 7
Prevalence of alternative splicing as a function of AGEZ size. For both plots, acceptor sites were excluded from consideration if there was another acceptor site ≤ 40 nucleotides upstream (see Materials and methods). In order to constrain the domain of the plots, all AGEZ values greater than 300 nucleotides were taken as 300 nucleotides. For both plots the standard error was calculated as sqrt(_r_·(n - r)/n), with n being the total number of acceptor sites/introns in the group, and r being the number of these seen to undergo alternative splicing of the defined type. See Materials and methods for further details. (a) Frequency of observed cassette exon alternative splicing as a function of the AGEZ for considered acceptor sites. The overall average is 19.8% (red line). The three data points representing AGEZ ≥ 150 nucleotides correspond to 197 exons with an average 32.5% observed cassette alternative exons. (b) Frequency of observed 3' splice site exon isoform alternative splicing as a function of the AGEZ for considered acceptor sites. The overall average is 9.6% (red line), with the first data point representing 8,657 exons having AGEZ values between 12 and 19 inclusive, and with 15.1% of these having observed acceptor site isoforms (intriguingly these are not a consequence of examining the downstream of two closely spaced acceptor sites because these have been excluded). AGEZ, AG exclusion zone.
Figure 8
Mutations that insert AG dinucleotides in a large AGEZ impair gene expression. (a) Rat α-tropomyosin (TM) minigene constructs and sequence between exon 3 branch point (in bold) and 3' splice site CAG. The underlined Ts are positions where mutagenesis to A created a new AG dinucleotide in mutants 3a and b. (b) In vitro spliced [32P]labelled RNA was analyzed by phosphorimaging after denaturing PAGE. The fully spliced 134 product is indicated by the black diamonds, and the intron lariat resulting from excision of the intron between exons 1 and 3 by the open circles. The sizes of these two bands varied, consistent with use of the first AG downstream of the dBP for splicing of exon 3. (c) Reverse transcriptase polymerase chain reaction analysis of transiently expressed constructs in HeLa cells. No bands corresponding to skipping or inclusion of exon 3 using either AG dinucleotide were observed in mutants 3a and 3b. The wild type construct shows a band corresponding to spliced exons 1-3-4. WT, wild type;
Similar articles
- Four exons of the serotonin receptor 4 gene are associated with multiple distant branch points.
Hallegger M, Sobala A, Smith CW. Hallegger M, et al. RNA. 2010 Apr;16(4):839-51. doi: 10.1261/rna.2013110. Epub 2010 Mar 2. RNA. 2010. PMID: 20197377 Free PMC article. - Human GC-AG alternative intron isoforms with weak donor sites show enhanced consensus at acceptor exon positions.
Thanaraj TA, Clark F. Thanaraj TA, et al. Nucleic Acids Res. 2001 Jun 15;29(12):2581-93. doi: 10.1093/nar/29.12.2581. Nucleic Acids Res. 2001. PMID: 11410667 Free PMC article. - Disease-causing mutations improving the branch site and polypyrimidine tract: pseudoexon activation of LINE-2 and antisense Alu lacking the poly(T)-tail.
Meili D, Kralovicova J, Zagalak J, Bonafé L, Fiori L, Blau N, Thöny B, Vorechovsky I. Meili D, et al. Hum Mutat. 2009 May;30(5):823-31. doi: 10.1002/humu.20969. Hum Mutat. 2009. PMID: 19280650 - Exonization of transposed elements: A challenge and opportunity for evolution.
Schmitz J, Brosius J. Schmitz J, et al. Biochimie. 2011 Nov;93(11):1928-34. doi: 10.1016/j.biochi.2011.07.014. Epub 2011 Jul 26. Biochimie. 2011. PMID: 21787833 Review. - The missing puzzle piece: splicing mutations.
Lewandowska MA. Lewandowska MA. Int J Clin Exp Pathol. 2013 Nov 15;6(12):2675-82. eCollection 2013. Int J Clin Exp Pathol. 2013. PMID: 24294354 Free PMC article. Review.
Cited by
- Large-scale mapping of branchpoints in human pre-mRNA transcripts in vivo.
Taggart AJ, DeSimone AM, Shih JS, Filloux ME, Fairbrother WG. Taggart AJ, et al. Nat Struct Mol Biol. 2012 Jun 17;19(7):719-21. doi: 10.1038/nsmb.2327. Nat Struct Mol Biol. 2012. PMID: 22705790 Free PMC article. - Four exons of the serotonin receptor 4 gene are associated with multiple distant branch points.
Hallegger M, Sobala A, Smith CW. Hallegger M, et al. RNA. 2010 Apr;16(4):839-51. doi: 10.1261/rna.2013110. Epub 2010 Mar 2. RNA. 2010. PMID: 20197377 Free PMC article. - Transcriptome analysis of hypoxic cancer cells uncovers intron retention in EIF2B5 as a mechanism to inhibit translation.
Brady LK, Wang H, Radens CM, Bi Y, Radovich M, Maity A, Ivan C, Ivan M, Barash Y, Koumenis C. Brady LK, et al. PLoS Biol. 2017 Sep 29;15(9):e2002623. doi: 10.1371/journal.pbio.2002623. eCollection 2017 Sep. PLoS Biol. 2017. PMID: 28961236 Free PMC article. - Alternative splicing of U2AF1 reveals a shared repression mechanism for duplicated exons.
Kralovicova J, Vorechovsky I. Kralovicova J, et al. Nucleic Acids Res. 2017 Jan 9;45(1):417-434. doi: 10.1093/nar/gkw733. Epub 2016 Aug 26. Nucleic Acids Res. 2017. PMID: 27566151 Free PMC article. - SpliceAPP: an interactive web server to predict splicing errors arising from human mutations.
Huang AC, Su JY, Hung YJ, Chiang HL, Chen YT, Huang YT, Yu CA, Lin HN, Lin CL. Huang AC, et al. BMC Genomics. 2024 Jun 15;25(1):600. doi: 10.1186/s12864-024-10512-x. BMC Genomics. 2024. PMID: 38877417 Free PMC article.
References
Publication types
MeSH terms
Substances
LinkOut - more resources
Full Text Sources


