Overexpression of activated murine Notch1 and Notch3 in transgenic mice blocks mammary gland development and induces mammary tumors - PubMed (original) (raw)
Overexpression of activated murine Notch1 and Notch3 in transgenic mice blocks mammary gland development and induces mammary tumors
Chunyan Hu et al. Am J Pathol. 2006 Mar.
Abstract
The mouse mammary tumor virus (MMTV) provirus was found to target the Notch1 gene, producing insertional mutations in mammary tumors of MMTV/neu transgenic (Tg) mice. In these mammary tumors, the Notch1 gene is truncated upstream of the transmembrane domain, and the resulting Notch1 intracellular domain (Notch1(intra)), deleted of most extracellular sequences, is overexpressed. Although Notch1(intra) transforms mammary epithelial cells in vitro, its role in mammary gland tumor formation in vivo was not studied. Therefore, we generated MMTV/Notch1(intra) Tg mice that overexpress murine Notch1(intra) in the mammary glands. We observed that MMTV/Notch1(intra) Tg females were unable to feed their pups because of impaired ductal and lobulo-alveolar mammary gland development. This was associated with decreased proliferation of ductal and alveolar epithelial cells during rapid expansion at puberty and in early pregnancy, as well as decreased production of beta-casein. Notch1(intra) repressed expression of the beta-casein gene promoter, as assessed in vitro with a beta-casein/luciferase reporter construct. The MMTV/Notch1(intra) Tg females developed mammary gland tumors, confirming the oncogenic potential of Notch1(intra) in vivo. Furthermore, MMTV/Notch3(intra) Tg mice exhibited a very similar phenotype. Thus, these Tg mice represent novel models for studying the role of Notch1 or Notch3 in the development and transformation of the mammary gland.
Figures
Figure 1
Structure of the MMTV/Notch1intra transgene. A: The cDNA encoding the intracellular domain of murine _Notch1_was ligated to the MMTV LTR promoter (open box). The 2.8-kbp Notch1 intra cDNA includes the transmembrane domain (black bar), the six ankyrin (Ank) repeats (strippled boxes), and the OPA/PEST sequences (striped bars). S, _Sac_I; B, _Bam_HI. B: Reverse transcriptase-polymerase chain reaction analysis of transgene RNA expression in mammary glands of pregnant (18.5 days) Tg (+) and control non-Tg (−) mice (F47400).
Figure 2
Histological evaluation of mammary glands from virgin MMTV/Notch1intra Tg mice. Mammary glands from young (12 weeks) (A, B) and older (10 months old) (C, D) virgin non-Tg (A, C), and Tg (B, D) mice. Note the dysplasia and the hyperplastic zones of epithelial cells and the enlarged ducts in the mammary gland of an older Tg mouse. Insets (C, D) show the areas delineated by a square at higher magnification. Note at the left of the arrow in D a multilayer epithelium adjacent to apparently normal epithelium at the right of the arrow. Original magnifications: ×10; ×40 (insets in C, D).
Figure 3
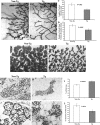
Whole mounts and histological analysis of mammary glands from pregnant MMTV/Notch1intra Tg females. Inguinal mammary glands from Tg females and control non-Tg littermates (line 47400) were compared by whole mount (A–F) or histological (G–L) analysis. Mammary glands from early (6.5 days) (A–D) and late (18.5 days) (E–L) pregnancy. Length of tertiary branches (C), density of alveoli (number per mm) (D), and area occupied by fat (I) and by secretory vesicles (per alveoli) (L) were evaluated. Original magnifications: ×10 (G, H); ×40 (J, K).
Figure 4
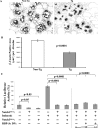
Whole mounts, histological, and TUNEL analysis of mammary ductal changes in MMTV/Notch1intra Tg mice at 4-day involution. Inguinal mammary glands from female Tg (F47400) and their non-Tg littermates were compared by whole mount (A–C) and by histological (H&E staining) (D–F) and TUNEL (G–I) analyses. Mammary glands at 4-day involution after the first (B) or the third (A, C, D–I) pregnancy. Note that enlarged ducts were rarely observed in young Tg mice after the first pregnancy (B, square) but frequently after the third pregnancy (C, F, H). Enlarged Tg ducts are surrounded by less connective tissue (F, H) than non-Tg ones (D, G). I: TUNEL-positive epithelial cells in normal-size or enlarged Tg ducts as well as in non-Tg ducts were quantitated. Statistical analyses was performed with the Student’s _t_-test. Symbols: asterisks in D–F: ductal lumen; arrows in G and H: TUNEL-positive cells. Original magnifications: ×10 (D–F); ×40 (G, H).
Figure 5
Expression of the milk β-casein protein in mammary glands of MMTV/Notch1intra Tg mice. A: Mammary glands from pregnant (18 days) female mice were analyzed by IHC for expression of the milk β-casein protein, using rabbit anti-β-casein antibodies on tissue sections. B: Data were quantitated by image analysis (P < 0.0001). C: β-Casein/luciferase reporter assay in 293T cells in the presence (+) or absence (−) of Notch1intra, Notch3intra, or RBP-Jκ dominant-negative mutant (1.0 and 2.5 μg). The dotted line indicates that these experiments were done separately. Original magnifications, ×20.
Figure 6
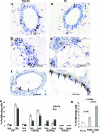
Proliferation of epithelial cells from mammary glands of MMTV/Notch1intra Tg mice. Proliferation was assayed by BrdU incorporation after intraperitoneal inoculation of non-Tg (A, C, E) and Tg (B, D, F) mice. BrdU-positive cells (some shown with arrows) were detected by IHC with anti-BrdU antibodies. Ducts (A, B) and alveoli (C, D) were evaluated independently during early pregnancy (6.5 days). The same experiment was also performed in virgin and late pregnancy and during 4-day involution after the first pregnancy (G), as well as during involution (4 days) after the third pregnancy (E, F, H). Statistical analysis was performed with Student’s _t_-test. **P < 0.003, ***P < 0.0005. Original magnifications, ×40.
Figure 7
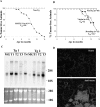
Incidence of tumor formation and transgene RNA expression in mammary tumors from MMTV/Notch1intra Tg females. A: Tg females (n = 25) (line 47400) (filled squares) and control non-Tg female littermates (n = 25) (open squares) bred on a mixed BALB/c-CD1 background and allowed to have multiple pregnancies were observed for the appearance of mammary tumors for up to 15 months. B: In a second experiment, virgin (filled squares) and breeding (asterisks) Tg females bred on the CD1 background for at least eight generations were studied and compared to non-Tg females (open squares). T50: Time required for 50% of Tg mice to develop large mammary tumors requiring the sacrifice of the diseased mice. C: Northern blot analysis. Total RNA extracted from distinct tumors (T) and from lactating mammary glands (MG) from two MMTV/Notch1intra Tg mice (line 47400) were hybridized with a 32P-labeled Notch1 probe K. A Notch1-specific RNA species of the expected size (3 kb) is observed. Ethidium bromide of the agarose gel is presented as control for the loading of RNAs. D: In situ hybridization of sections of mammary tumors from a Tg female (line 47400) were hybridized with 35S-labeled Notch1intra anti-sense and control sense riboprobes. Note that very high levels of expression of the Notch1 Tg is observed with the anti-sense probe in the neoplastic tissue. Original magnifications, ×10.
Figure 8
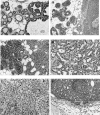
Histopathology of mammary lesions from MMTV/Notch1intra Tg females. Representative sections of various types of mammary gland lesions from MMTV/Notch1intra Tg females (lines 47400 and 39580) are shown. A: Epithelial hyperplastic changes with increased number of ducts (left) and formation of tufts and papillary excrescences protruding into the lumina (right). B: Intraductal epithelial hyperplasia with lumina induced to slit-like spaces (left) and adjacent invasive carcinoma (right). C: Higher magnification of ductal hyperplastic changes (left) composed of epithelial cells with small regular nuclei contrasting with adjacent invasive carcinoma in which the nuclei are enlarged and hyperchromatic. D: Moderately differentiated carcinoma forming glandular structures with open lumina. E: Poorly differentiated carcinoma showing a solid growth pattern and numerous mitoses (arrows). F: Focus of necrosis (top middle third) in a carcinoma. H&E stain. Original magnifications, ×20.
Figure 9
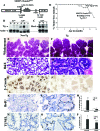
Analysis of MMTV/Notch3intra Tg mice. A: Structure of the MMTV/Notch3intra transgene construct. B: Tg RNA expression. Expression was measured on total RNA (20 μg) from mammary glands of pregnant (18.5 days) MMTV/Notch3intra (N3IC) or MMTV/Notch1intra (N1IC) Tg (+) and non-Tg (−) mice by Northern blot analysis using the 32P-labeled U5 LTR probe specific to both transgenes. The membrane was washed and rehybridized with the actin probe (bottom). C: Hes1 expression. Expression was measured as described above in B, using the Hes1 probe. D: Incidence of tumor formation. Parous Tg females (asterisks) and control non-Tg female littermates (open squares) were observed for the appearance of mammary tumors for up to 16 months. E–P: Analysis of mammary glands from pregnant female mice at their first pregnancy (18.5 days). E and F: Whole mounts. Note the enhanced and much condensed lobules and alveoli in Tg mice. G and H: Histological sections of alveoli. Reduced number of secretory vesicles and hyperplasia are observed in Tg alveoli. I and J: β-Casein expression. IHC analysis was performed with rabbit anti-β-casein antibodies on tissue sections. K–M: Assessment of proliferation. Proliferation of alveolar epithelial cells was measured after BrdU incorporation as described in the legend to Figure 6, and quantitated (M). N–P: Assessment of apoptosis. TUNEL assay was used to measure the number of apoptotic alveolar epithelial cells and the percentage of apoptotic epithelial cells was quantitated (P). Statistical analysis in M and P was performed with the Student’s _t_-test. *P < 0.05, **P < 0.003, ***P < 0.0005. Original magnifications: ×20 (I–L); ×40 (G, H, N, O).
Similar articles
- Involvement of Notch1 in the development of mouse mammary tumors.
Diévart A, Beaulieu N, Jolicoeur P. Diévart A, et al. Oncogene. 1999 Oct 28;18(44):5973-81. doi: 10.1038/sj.onc.1202991. Oncogene. 1999. PMID: 10557086 - RANK overexpression in transgenic mice with mouse mammary tumor virus promoter-controlled RANK increases proliferation and impairs alveolar differentiation in the mammary epithelia and disrupts lumen formation in cultured epithelial acini.
Gonzalez-Suarez E, Branstetter D, Armstrong A, Dinh H, Blumberg H, Dougall WC. Gonzalez-Suarez E, et al. Mol Cell Biol. 2007 Feb;27(4):1442-54. doi: 10.1128/MCB.01298-06. Epub 2006 Dec 4. Mol Cell Biol. 2007. PMID: 17145767 Free PMC article. - TGF beta regulation of cell proliferation.
Moses HL, Arteaga CL, Alexandrow MG, Dagnino L, Kawabata M, Pierce DF Jr, Serra R. Moses HL, et al. Princess Takamatsu Symp. 1994;24:250-63. Princess Takamatsu Symp. 1994. PMID: 8983080 Review. - MMTV mouse models and the diagnostic values of MMTV-like sequences in human breast cancer.
Taneja P, Frazier DP, Kendig RD, Maglic D, Sugiyama T, Kai F, Taneja NK, Inoue K. Taneja P, et al. Expert Rev Mol Diagn. 2009 Jul;9(5):423-40. doi: 10.1586/erm.09.31. Expert Rev Mol Diagn. 2009. PMID: 19580428 Free PMC article. Review.
Cited by
- Notch promotes recurrence of dormant tumor cells following HER2/neu-targeted therapy.
Abravanel DL, Belka GK, Pan TC, Pant DK, Collins MA, Sterner CJ, Chodosh LA. Abravanel DL, et al. J Clin Invest. 2015 Jun;125(6):2484-96. doi: 10.1172/JCI74883. Epub 2015 May 11. J Clin Invest. 2015. PMID: 25961456 Free PMC article. - Identification of a Notch transcriptomic signature for breast cancer.
Braune EB, Geist F, Tang X, Kalari K, Boughey J, Wang L, Leon-Ferre RA, D'Assoro AB, Ingle JN, Goetz MP, Kreis J, Wang K, Foukakis T, Seshire A, Wienke D, Lendahl U. Braune EB, et al. Breast Cancer Res. 2024 Jan 3;26(1):4. doi: 10.1186/s13058-023-01757-7. Breast Cancer Res. 2024. PMID: 38172915 Free PMC article. - Notch2 signaling induces apoptosis and inhibits human MDA-MB-231 xenograft growth.
O'Neill CF, Urs S, Cinelli C, Lincoln A, Nadeau RJ, León R, Toher J, Mouta-Bellum C, Friesel RE, Liaw L. O'Neill CF, et al. Am J Pathol. 2007 Sep;171(3):1023-36. doi: 10.2353/ajpath.2007.061029. Epub 2007 Aug 3. Am J Pathol. 2007. PMID: 17675579 Free PMC article. - Inhibitor of DNA Binding 2 Inhibits Epithelial-Mesenchymal Transition via Up-Regulation of Notch3 in Breast Cancer.
Wen XF, Chen M, Wu Y, Chen MN, Glogowska A, Klonisch T, Zhang GJ. Wen XF, et al. Transl Oncol. 2018 Oct;11(5):1259-1270. doi: 10.1016/j.tranon.2018.07.015. Epub 2018 Aug 14. Transl Oncol. 2018. PMID: 30119050 Free PMC article. - Mammary Development and Breast Cancer: a Notch Perspective.
Chen W, Wei W, Yu L, Ye Z, Huang F, Zhang L, Hu S, Cai C. Chen W, et al. J Mammary Gland Biol Neoplasia. 2021 Sep;26(3):309-320. doi: 10.1007/s10911-021-09496-1. Epub 2021 Aug 10. J Mammary Gland Biol Neoplasia. 2021. PMID: 34374886 Free PMC article. Review.
References
- Artavanis-Tsakonas S, Rand MD, Lake RJ. Notch signaling: cell fate control and signal integration in development. Science. 1999;284:770–776. - PubMed
- Greenwald I. LIN-12/Notch signaling: lessons from worms and flies. Genes Dev. 1998;12:1751–1762. - PubMed
- Lieber T, Kidd S, Alcamo E, Corbin V, Young MW. Antineurogenic phenotypes induced by truncated Notch proteins indicate a role in signal transduction and may point to a novel function for Notch in nuclei. Genes Dev. 1993;7:1949–1965. - PubMed
- Rebay I, Fehon RG, Artavanis-Tsakonas S. Specific truncations of Drosophila Notch define dominant activated and dominant negative forms of the receptor. Cell. 1993;74:319–329. - PubMed
- Struhl G, Fitzgerald K, Greenwald I. Intrinsic activity of the Lin-12 and Notch intracellular domains in vivo. Cell. 1993;74:331–345. - PubMed
Publication types
MeSH terms
Substances
LinkOut - more resources
Full Text Sources
Other Literature Sources
Molecular Biology Databases
Research Materials
Miscellaneous


