Tankyrase 2 poly(ADP-ribose) polymerase domain-deleted mice exhibit growth defects but have normal telomere length and capping - PubMed (original) (raw)
Tankyrase 2 poly(ADP-ribose) polymerase domain-deleted mice exhibit growth defects but have normal telomere length and capping
Susan J Hsiao et al. Mol Cell Biol. 2006 Mar.
Abstract
Regulation of telomere length maintenance and capping are a critical cell functions in both normal and tumor cells. Tankyrase 2 (Tnks2) is a poly(ADP-ribose) polymerase (PARP) that has been shown to modify itself and TRF1, a telomere-binding protein. We show here by overexpression studies that tankyrase 2, like its closely related homolog tankyrase 1, can function as a positive regulator of telomere length in human cells, dependent on its catalytic PARP activity. To study the role of Tnks2 in vivo, we generated mice with the Tnks2 PARP domain deleted. These mice are viable and fertile but display a growth retardation phenotype. Telomere analysis by quantitative fluorescence in situ hybridization (FISH), flow-FISH, and restriction fragment analysis showed no change in telomere length or telomere capping in these mice. To determine the requirement for Tnks2 in long-term maintenance of telomeres, we generated embryonic stem cells with the Tnks2 PARP domain deleted and observed no change, even upon prolonged growth, in telomere length or telomere capping. Together, these results suggest that Tnks2 has a role in normal growth and development but is not essential for telomere length maintenance or telomere capping in mice.
Figures
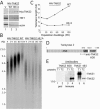
FIG. 1.
Human tankyrase 2 promotes telomere elongation. (A) Immunoblot analysis of whole-cell extracts from stable HTC75 cell lines expressing a vector control (V) or MN-tankyrase 2 wild type (MN-TNKS2.WT) or MN-tankyrase 2 HE/A (MN-TNKS2.HE/A). Immunoblots were probed with anti-Myc, anti-TRF1, or anti-β-actin antibodies. (B) Southern blot analysis of HinfI/RsaI-digested genomic DNA from stable HTC75 cell lines expressing MN-TNKS2.WT or HE/A at the indicated pd. Telomere restriction fragments were detected with a 32P-labeled TTAGGG repeat probe. (C) Graphical representation of telomere length changes in stable HTC75 cell lines expressing MN-TNKS2.WT or HE/A. Plots represent the mean telomere length values derived from the Southern blots in panel B. (D) Schematic diagram of human tankyrase 2. ANK, ankyrin repeat domain. The region against which anti-tankyrase 2 608 was raised is indicated by a line. (E) Immunoblot analysis demonstrating the specificity of anti-tankyrase 2 608. Partially purified baculovirus-derived tankyrase 1 (T1) or tankyrase 2 (T2) was fractionated by sodium dodecyl sulfate-polyacrylamide gel electrophoresis and analyzed by immunoblotting with preimmune (preI) serum, affinity-purified anti-tankyrase 2 608 (Immune), or anti-tankyrase 1 465. Numbers at left of panels B and E are molecular masses in kilobases and kilodaltons, respectively.
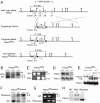
FIG. 2.
Targeted deletion of exons 25, 26, and 27 (encoding the catalytic PARP domain) of mouse Tnks2. (A) Schematics of the wild-type allele, targeting construct, targeted allele, and the _neo_-deleted targeted allele (top to bottom lines, respectively). The 4.3-, 5.1-, and 5.9-kb ScaI fragments used for genotyping are indicated. Positions of PCR primers used for genotyping are indicated by half arrows. LoxP sites are indicated by arrowheads. Bar indicates the 0.5-kb probe 0.2 kb upstream of exon 24 used for Southern blotting. Restriction sites: X, XbaI; S, ScaI; N, NcoI; K, KpnI; R, EcoRI. (B to E) Characterization of Tnks2 PDΔ. (B) Southern blot of ScaI-digested tail DNA from the indicated genotypes using the 0.5-kb probe indicated by a bar in panel A. (C) PCR analysis of mouse tail DNA of the indicated genotypes using the primers indicated in panel A. (D) Northern blot of total RNA from primary MEFs of the indicated genotypes. RNA was hybridized first with a radiolabeled tankyrase 2 probe and subsequently with a tankyrase 1 probe. (E) Immunoblot analysis of immortalized MEFs of the indicated genotypes. Cell extracts were immunoprecipitated with anti-tankyrase 1 465 (detects tankyrases 1 and 2) and immunoblotted with anti-tankyrase 2 608 or anti-tankyrase 1 465 antibodies. Asterisks indicate alternative products of Tnks2 lacking the catalytic PARP domain. (F to H) Characterization of Tnks2 PD_Δ_neoΔ. (F) Southern blot of ScaI-digested tail DNA of the indicated genotypes using the 0.5-kb probe indicated by the bar shown in panel A. (G) PCR analysis of mouse tail DNA of the indicated genotypes using the primers indicated in panel A. (H) Immunoblot analysis of brain extracts of the indicated genotypes. Brain extracts were immunoprecipitated with anti-tankyrase 1 465 (detects tankyrases 1 and 2) and immunoblotted with anti-tankyrase 2 608. The asterisks indicates an alternative product of Tnks2 lacking the catalytic PARP domain.
FIG. 3.
Tnks2_PDΔ_−/− and Tnks2 _PD_Δ_neoΔ_−/− mice are smaller than heterozygous or wild-type mice. (A) Photograph of a representative Tnks2 _PDΔ_−/− mouse and wild-type littermate at 6 weeks of age. (B) Growth curve of male Tnks2 PDΔ mice. Graph shows the average weights of Tnks2 _PDΔ_−/− (four male), Tnks2 PDΔ+/− (five male), and Tnks2 PDΔ+/+ (three male) mice taken on the day indicated (or the following day) for a period of 56 days. (C) Average organ weight (± standard error of the mean) of three Tnks2 _PDΔ_−/− mice compared to three Tnks2 PDΔ+/+ mice taken at 6 to 7 weeks of age. (D and E) Tnks2 _PD_Δ_neoΔ_−/− mice show the small mouse phenotype. (D) Photograph of a representative Tnks2 _PD_Δ_neoΔ_−/− mouse and Tnks2 PD_Δ_neoΔ+/− littermate at 6 weeks of age. (E) Macroscopic appearance of selected organs from a Tnks2 _PD_Δ_neoΔ_−/− mouse and Tnks2 PD_Δ_neoΔ+/− littermate at 6 weeks age.
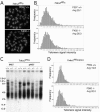
FIG. 4.
Telomere length analysis of Tnks2 PDΔ and Tnks2 PD_Δ_neoΔ mice. (A) Images of representative metaphase spreads from splenocytes of Tnks2 PDΔ+/+ or Tnks2 _PDΔ_−/− mice. DNA was stained with DAPI (4′,6′-diamidino-2-phenylindole), and telomeres were stained with a Cy3-labeled PNA telomere probe. (B) Q-FISH analysis of individual metaphase preparations from splenocytes of Tnks2 PDΔ+/+ or Tnks2 _PDΔ_−/− mice. Data were accumulated by using 10 metaphases for each histogram. The “frequency” or number of telomeres within a given range of telomeric DNA intensities was plotted against the telomere DNA signal intensity with arbitrary units (0 = no telomeric DNA signal, and increasing increments of arbitrary telomere fluorescence units up to 121). Average telomere length is indicated for each histogram. (C) Telomere restriction fragment analysis by pulsed-field gel electrophoresis of immortalized MEFs (iMEFs) or primary MEFs (pMEFs) from Tnks2 PDΔ+/+, Tnks2 PDΔ+/−, or Tnks2 _PDΔ_−/− mice. Numbers at left are molecular masses in kilobases. (D) Q-FISH analysis of individual metaphase preparations from splenocytes of Tnks2 PD_Δ_neoΔ+/+ or Tnks2 _PD_Δ_neoΔ_−/− mice was performed as described for panel B.
FIG. 5.
Analysis of Tnks2 PDΔ ES cells. (A) PCR analysis of Tnks2 PDΔ ES cells of the indicated genotypes (+/+; +/−; and two independently isolated −/− clones, A3 and C10) using the primers indicated in Fig. 2A. (B) Immunoblot analysis of Tnks2 PDΔ ES cells of the indicated genotypes. Cell extracts were immunoprecipitated with anti-tankyrase 1 465 (detects tankyrases 1 and 2) and immunoblotted with anti-tankyrase 2 608 or anti-tankyrase 1 465 antibodies. Asterisks indicate alternative products of Tnks2 lacking the catalytic PARP domain. (C) Images of representative metaphase spreads from Tnks2 _PDΔ_−/− ES cells (clone A3) at pd's 42 and 212. DNA was stained with DAPI, and telomeres were stained with a Cy3-labeled PNA telomere probe. (D) Q-FISH analysis of individual metaphase preparations from Tnks2 PDΔ+/+ or Tnks2 _PDΔ_−/− (clones A3 and C10) at pd's 42 and 212. Data were accumulated by using 10 metaphases for each histogram. The “frequency” or number of telomeres within a given range of telomeric DNA intensities was plotted against the telomere DNA signal intensity with arbitrary units (0 = no telomeric DNA signal, and increasing increments of arbitrary telomere fluorescence units up to 121). Average telomere length is indicated for each histogram.
Similar articles
- Role for the related poly(ADP-Ribose) polymerases tankyrase 1 and 2 at human telomeres.
Cook BD, Dynek JN, Chang W, Shostak G, Smith S. Cook BD, et al. Mol Cell Biol. 2002 Jan;22(1):332-42. doi: 10.1128/MCB.22.1.332-342.2002. Mol Cell Biol. 2002. PMID: 11739745 Free PMC article. - Telomere elongation by a mutant tankyrase 1 without TRF1 poly(ADP-ribosyl)ation.
Muramatsu Y, Tahara H, Ono T, Tsuruo T, Seimiya H. Muramatsu Y, et al. Exp Cell Res. 2008 Mar 10;314(5):1115-24. doi: 10.1016/j.yexcr.2007.12.005. Epub 2007 Dec 14. Exp Cell Res. 2008. PMID: 18221737 - TIN2 is a tankyrase 1 PARP modulator in the TRF1 telomere length control complex.
Ye JZ, de Lange T. Ye JZ, et al. Nat Genet. 2004 Jun;36(6):618-23. doi: 10.1038/ng1360. Epub 2004 May 9. Nat Genet. 2004. PMID: 15133513 - Pleiotropic roles of tankyrase/PARP proteins in the establishment and maintenance of human naïve pluripotency.
Zimmerlin L, Zambidis ET. Zimmerlin L, et al. Exp Cell Res. 2020 May 1;390(1):111935. doi: 10.1016/j.yexcr.2020.111935. Epub 2020 Mar 7. Exp Cell Res. 2020. PMID: 32151493 Free PMC article. Review. - Tankyrase function at telomeres, spindle poles, and beyond.
Hsiao SJ, Smith S. Hsiao SJ, et al. Biochimie. 2008 Jan;90(1):83-92. doi: 10.1016/j.biochi.2007.07.012. Epub 2007 Jul 24. Biochimie. 2008. PMID: 17825467 Review.
Cited by
- Nuclear ADP-ribosylation reactions in mammalian cells: where are we today and where are we going?
Hassa PO, Haenni SS, Elser M, Hottiger MO. Hassa PO, et al. Microbiol Mol Biol Rev. 2006 Sep;70(3):789-829. doi: 10.1128/MMBR.00040-05. Microbiol Mol Biol Rev. 2006. PMID: 16959969 Free PMC article. Review. - Tankyrase Regulates Neurite Outgrowth through Poly(ADP-ribosyl)ation-Dependent Activation of β-Catenin Signaling.
Mashimo M, Kita M, Uno A, Nii M, Ishihara M, Honda T, Gotoh-Kinoshita Y, Nomura A, Nakamura H, Murayama T, Kizu R, Fujii T. Mashimo M, et al. Int J Mol Sci. 2022 Mar 4;23(5):2834. doi: 10.3390/ijms23052834. Int J Mol Sci. 2022. PMID: 35269974 Free PMC article. - Loss of Tankyrase-mediated destruction of 3BP2 is the underlying pathogenic mechanism of cherubism.
Levaot N, Voytyuk O, Dimitriou I, Sircoulomb F, Chandrakumar A, Deckert M, Krzyzanowski PM, Scotter A, Gu S, Janmohamed S, Cong F, Simoncic PD, Ueki Y, La Rose J, Rottapel R. Levaot N, et al. Cell. 2011 Dec 9;147(6):1324-39. doi: 10.1016/j.cell.2011.10.045. Cell. 2011. PMID: 22153076 Free PMC article. - The PARP Enzyme Family and the Hallmarks of Cancer Part 1. Cell Intrinsic Hallmarks.
Demény MA, Virág L. Demény MA, et al. Cancers (Basel). 2021 Apr 23;13(9):2042. doi: 10.3390/cancers13092042. Cancers (Basel). 2021. PMID: 33922595 Free PMC article. Review. - Regulation of Wnt/β-catenin signalling by tankyrase-dependent poly(ADP-ribosyl)ation and scaffolding.
Mariotti L, Pollock K, Guettler S. Mariotti L, et al. Br J Pharmacol. 2017 Dec;174(24):4611-4636. doi: 10.1111/bph.14038. Epub 2017 Nov 5. Br J Pharmacol. 2017. PMID: 28910490 Free PMC article. Review.
References
- Ame, J. C., C. Spenlehauer, and G. de Murcia. 2004. The PARP superfamily. Bioessays 26:882-893. - PubMed
- Ancelin, K., M. Brunori, S. Bauwens, C. E. Koering, C. Brun, M. Ricoul, J. P. Pommier, L. Sabatier, and E. Gilson. 2002. Targeting assay to study the cis functions of human telomeric proteins: evidence for inhibition of telomerase by TRF1 and for activation of telomere degradation by TRF2. Mol. Cell. Biol. 22:3474-3487. - PMC - PubMed
- Bae, J., J. R. Donigian, and A. J. Hsueh. 2003. Tankyrase 1 interacts with Mcl-1 proteins and inhibits their regulation of apoptosis. J. Biol. Chem. 278:5195-5204. - PubMed
- Baerlocher, G. M., J. Mak, T. Tien, and P. M. Lansdorp. 2002. Telomere length measurement by fluorescence in situ hybridization and flow cytometry: tips and pitfalls. Cytometry 47:89-99. - PubMed
- Bai, C. B., W. Auerbach, J. S. Lee, D. Stephen, and A. L. Joyner. 2002. Gli2, but not Gli1, is required for initial Shh signaling and ectopic activation of the Shh pathway. Development 129:4753-4761. - PubMed
Publication types
MeSH terms
Substances
Grants and funding
- R01 CA95099/CA/NCI NIH HHS/United States
- T32 GM007308/GM/NIGMS NIH HHS/United States
- T32 GM007238/GM/NIGMS NIH HHS/United States
- R01 CA095099/CA/NCI NIH HHS/United States
- GM07308/GM/NIGMS NIH HHS/United States
- GM07238/GM/NIGMS NIH HHS/United States
LinkOut - more resources
Full Text Sources
Molecular Biology Databases


