A new description of cellular quiescence - PubMed (original) (raw)
A new description of cellular quiescence
Hilary A Coller et al. PLoS Biol. 2006 Mar.
Abstract
Cellular quiescence, defined as reversible growth/proliferation arrest, is thought to represent a homogenous state induced by diverse anti-mitogenic signals. We used transcriptional profiling to characterize human diploid fibroblasts that exited the cell cycle after exposure to three independent signals--mitogen withdrawal, contact inhibition, and loss of adhesion. We show here that each signal caused regulation of a unique set of genes known to be important for cessation of growth and division. Therefore, contrary to expectation, cells enter different quiescent states that are determined by the initiating signal. However, underlying this diversity we discovered a set of genes whose specific expression in non-dividing cells was signal-independent, and therefore representative of quiescence per se, rather than the signal that induced it. This fibroblast "quiescence program" contained genes that enforced the non-dividing state, and ensured the reversibility of the cell cycle arrest. We further demonstrate that one mechanism by which the reversibility of quiescence is insured is the suppression of terminal differentiation. Expression of the quiescence program was not simply a downstream consequence of exit from the cell cycle, because key parts, including those involved in suppressing differentiation, were not recapitulated during the cell cycle arrest caused by direct inhibition of cyclin-dependent kinases. These studies form a basis for understanding the normal biology of cellular quiescence.
Figures
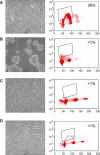
Figure 1. Model System: Growing and Arrested Cells
Photographs of growing cells (A), and cells arrested overnight by loss of adhesion (B), contact inhibition (C), or mitogen withdrawal (D) are shown. Growing cells and cells that were arrested for 4 d by one of the three different arrest signals were incubated with bromodeoxyuridine (BrdU). Cell nuclei were labeled with an anti-BrdU antibody and propidium iodide, and analyzed by FACS. DNA content was plotted along the _x_-axis, and BrdU intensity was plotted along the _y_-axis. In growing cells, 28% of the nuclei incorporated BrdU during a 6-h incubation, while less than 1% of the arrested cells incorporated BrdU during the same time period. At 14 h <10% of the cells were in S phase. 2N (G1) cells in all conditions were purified by sorting.
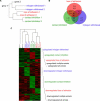
Figure 2. Quiescence Initiation
(A) Neighbor-joining tree of quiescence initiation. Samples of growing cells and cells arrested by a single signal for 14 h were flow-sorted. Transcriptional distances (Affymetrix Genechip suite 4.0.) were determined for each pairwise comparison among samples as described in Materials and Methods. A matrix of transcriptional distances was used to generate a tree depicting the relationship among the growing and quiescent cells using neighbor-joining methods. (B) Venn diagrams depicting the number of genes regulated by one, two, or three arrest signals during quiescence initiation. The number of genes that were regulated by a single signal, by two out of three signals, or by all three signals was determined based on either consistent 2-fold-->regulation or “template-matching.” The number of genes expected to be downregulated by a single signal by chance is 7.8, and the number observed was statistically significant for all three arrest methods (p < 0.001). The number of genes expected to be upregulated by a single signal by chance is 5.1. The signature for genes upregulated by mitogen withdrawal or contact inhibition alone is significant at p < 0.001, while the signature for genes upregulated by loss of adhesion is significant at p = 0.004. One gene was expected to be downregulated by two out of three signals by chance. For mitogen withdrawal combined with contact inhibition, and loss of adhesion combined with contact inhibition, the observed number of downregulated genes was statistically significantly higher than expectation (p < 0.001). For mitogen withdrawal combined with loss of adhesion, the result was not statistically significant. The expected number of genes upregulated by two arrest signals is 0.75. For genes upregulated by mitogen withdrawal combined with contact inhibition, and by loss of adhesion combined with contact inhibition, the number of regulated genes is significant (p < 0.001). For mitogen withdrawal combined with loss of adhesion, the result was not statistically significant. The number of genes expected to be downregulated by all three signals was 0.85, and the observation of four was significant at p = 0.009. The number of genes expected to be upregulated by all three arrest signals is 1.2, and the observation of five is significant at p = 0.006. (C) “Heat maps” of genes regulated during quiescence initiation. Samples of growing cells and cells arrested by a single signal for 14 h were flow sorted and analyzed with microarrays. Genes regulated by one, two, or all three signals were identified both by consistent 2-fold change and by “template-matching” as described in Materials and Methods. Genes are represented by rows; columns indicate samples. The average difference values for each gene were normalized. The relative expression levels for a gene among the samples are indicated by green for a low value and by red for a high value. The figure was generated with Java Treeview [54]. The dendrogram above the figure depicts the topology of a neighbor-joining tree generated from the transcriptional distances between each sample. The complete tree is shown in (A).
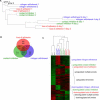
Figure 3. Quiescence Maintenance
(A) Neighbor-joining tree of quiescence initiation and maintenance. Neighbor-joining tree of the transcriptional distance between samples after overnight and 4 d of quiescence generated as described in Figure 2A. (B) Venn diagrams depicting the number of genes regulated by one, two, or three arrest signals during quiescence maintenance. Methods are as described in (Figure 2B), except that cells were arrested for 4 d. The number of genes downregulated specifically by mitogen withdrawal or by loss of adhesion was significantly greater than the expectation (7.8 genes) at p < 0.001. The number of genes downregulated by contact inhibition was not statistically significant. The expected number of genes upregulated by a single signal was 5.1, and the signature for genes upregulated by each of the signals individually was statistically significant (p < 0.001). The expected number of genes downregulated by two signals was one, and the observed values for all three combinations were significant at p < 0.001. The expected number of genes downregulated by all three arrest signals was 0.85, and the observed value of 33 was highly significant (p < 0.001). All combinations of upregulation by two signals were statistically significantly elevated (p < 0.001) as compared with the expectation of 0.75 genes. The number of genes expected to be upregulated by all three signals was 1.2, and the observed value of 96 was significantly different (p < 0.001). (C) “Heat maps” of genes regulated during quiescence maintenance. “Heat map” of the genes regulated after 4 d of quiescence and dendrogram are as described in Figure 2C.
Figure 4. Summary of the Relationships among Quiescent States
In cells arrested overnight by a specific arrest signal, gene expression changes are largely signal-specific with a small amount of overlap. When cells have been arrested for 4 d, there continue to be signal-specific changes, but now there are a large number of commonly regulated genes that we refer to as a “quiescence program.” In cells arrested for 20 d, the intensity of the changes in the quiescence program are magnified. The three circles are intended to reflect the enhancement of the quiescence program at 20 d. We have not analyzed all the three arrest conditions at this late time point. When cells are arrested by a combination of extracellular signals, quiescence program gene expression changes appear after only an overnight arrest.
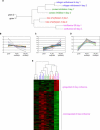
Figure 5. Change in Expression with Longer Arrest Time
(A) Neighbor-joining tree defining the relationship between growing cells, cells arrested by mitogen withdrawal, contact inhibition, or loss of adhesion for 4 d, and by growth to confluence for 20 d. Transcriptional distances (Genechip suite 4.0) were determined and used to construct the distance matrix and neighbor-joining tree as described in Figure 2A. (B–D) Plot of expression levels in quiescence program genes in growing, 4-d confluent and 20-d confluent cells. Mean expression values in growing cells, cells arrested by growth to confluence for 4 d and cells arrested by growth to confluence for 20 d were normalized by dividing by the average value. The data are plotted for (B), all downregulated quiescence program genes; (C), the 89 upregulated quiescence program genes that were more strongly upregulated at 20 d than 4 d; and (D), the 26 upregulated quiescence program genes that were more strongly upregulated at 4 d than 20 d. (E) Heat maps of gene expression changes characteristic of longer arrest. Gene expression patterns for genes downregulated or upregulated in 20-d confluent cells but not cells arrested by mitogen withdrawal, contact inhibition, or loss of adhesion for 4 d are shown. Heat maps were generated as described for Figure 2C. The expected number of genes, 1.3 upregulated genes and 0.5 downregulated genes, were determined by permutation testing. The observed values of 26 and 87, respectively, are highly significant (p ≪ 0.001).
Figure 6. Combination of Arrest Signals Results in Synergistic Effects
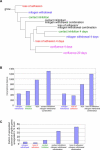
(A) Neighbor-joining tree defining the relationship among growing cells, cells arrested by a single signal overnight, by a combination of signals, by single signals for 4 d and by longer arrest. Transcriptional distances (Genechip suite 4.0) were determined and the mean transcriptional distances for the two examples of each arrest condition were used to construct the distance matrix and neighbor-joining tree. (B) Mean transcriptional distance from growing cells to cells arrested by individual signals overnight, and the sum of the distances, is plotted, and compared with the transcriptional distance from growing cells to cells arrested overnight by a combination of signals. (C) The fraction of upregulated quiescence program genes that were upregulated by each individual signal and by combinations of signals after an overnight arrest.
Figure 7. Cells Arrested by CKI Overexpression
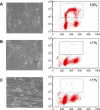
Photographs of cells transduced with an empty vector (A), or a vector encoding p21 (B), or p27 (C). Methods and axes are as in Figure 1. Tetraploid cells were gated out. In cells transduced with an empty vector, 19% of the nuclei incorporated BrdU, while less than 1% of cells expressing p21 or p27 incorporated BrdU during the same time period.
Figure 8. CKI Overexpression Does Not Closely Resemble the Quiescent State Induced by Any Extracellular Signal
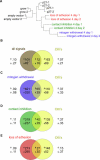
(A) Neighbor-joining tree of growing cells, cells arrested by extracellular signals for 4 d, cells transduced with an empty vector, and cells transduced with a CKI. Transcriptional distances were determined for all pairwise comparisons (Genechip suite 5.0), and neighbor-joining trees were drawn as described in Materials and Methods. (B–E) The overlap between genes regulated by CKI overexpression and genes consistently regulated by all signals (B), mitogen withdrawal (C), contact inhibition (D), or loss of adhesion (E) was determined. The number of regulated genes is shown within the circle. The fraction of regulated genes within the overlap area is provided outside the circles. Genes consistently downregulated by all three arrest signals were most likely to be regulated by CKI overexpression.
Figure 9. Quiescence, but Not Simply Cell-Cycle Arrest, Protects against Differentiation
Human dermal fibroblasts 91-SF5 were transduced with a MyoD-estrogen receptor fusion, selected for stably transduced cells, and differentiated. At the indicated time points after differentiation, myogenin (A–C) and myosin heavy chain (D–F) expression levels were determined with real time RT-PCR using GAPDH as an internal standard and normalized values were plotted. Myogenesis marker expression induced by differentiation was inhibited in cells that were made quiescent for 4 d by serum withdrawal (A and D) or contact inhibition (B and E) as compared with growing cells. In contrast, in cells arrested by overexpression of the CKI p21, there was no reduction in myogenesis marker expression as compared with control cells transduced with an empty vector (C and F).
Comment in
- Quiet time: gene program prevents division but keeps cells at the ready.
Robinson R. Robinson R. PLoS Biol. 2006 Mar;4(3):e85. doi: 10.1371/journal.pbio.0040085. Epub 2006 Mar 7. PLoS Biol. 2006. PMID: 20076544 Free PMC article. No abstract available.
Similar articles
- Tumor suppressor gene p16/INK4A/CDKN2A-dependent regulation into and out of the cell cycle in a spontaneous canine model of breast cancer.
Agarwal P, Sandey M, DeInnocentes P, Bird RC. Agarwal P, et al. J Cell Biochem. 2013 Jun;114(6):1355-63. doi: 10.1002/jcb.24476. J Cell Biochem. 2013. PMID: 23238983 - Overexpression of Far1, a cyclin-dependent kinase inhibitor, induces a large transcriptional reprogramming in which RNA synthesis senses Far1 in a Sfp1-mediated way.
Busti S, Gotti L, Balestrieri C, Querin L, Drovandi G, Felici G, Mavelli G, Bertolazzi P, Alberghina L, Vanoni M. Busti S, et al. Biotechnol Adv. 2012 Jan-Feb;30(1):185-201. doi: 10.1016/j.biotechadv.2011.09.007. Epub 2011 Sep 21. Biotechnol Adv. 2012. PMID: 21964263 - Preferential gene expression in quiescent human lung fibroblasts.
Coppock DL, Kopman C, Scandalis S, Gilleran S. Coppock DL, et al. Cell Growth Differ. 1993 Jun;4(6):483-93. Cell Growth Differ. 1993. PMID: 8396966 - Dormancy and quiescence of skeletal muscle stem cells.
Rocheteau P, Vinet M, Chretien F. Rocheteau P, et al. Results Probl Cell Differ. 2015;56:215-35. doi: 10.1007/978-3-662-44608-9_10. Results Probl Cell Differ. 2015. PMID: 25344673 Review. - The flexible evolutionary anchorage-dependent Pardee's restriction point of mammalian cells: how its deregulation may lead to cancer.
David-Pfeuty T. David-Pfeuty T. Biochim Biophys Acta. 2006 Jan;1765(1):38-66. doi: 10.1016/j.bbcan.2005.08.008. Epub 2005 Sep 20. Biochim Biophys Acta. 2006. PMID: 16219425 Review.
Cited by
- Progressively De-Differentiated Pancreatic Cancer Cells Shift from Glycolysis to Oxidative Metabolism and Gain a Quiescent Stem State.
Ambrosini G, Dalla Pozza E, Fanelli G, Di Carlo C, Vettori A, Cannino G, Cavallini C, Carmona-Carmona CA, Brandi J, Rinalducci S, Scupoli MT, Rasola A, Cecconi D, Palmieri M, Dando I. Ambrosini G, et al. Cells. 2020 Jun 28;9(7):1572. doi: 10.3390/cells9071572. Cells. 2020. PMID: 32605166 Free PMC article. - Compressive force induces reversible chromatin condensation and cell geometry-dependent transcriptional response.
Damodaran K, Venkatachalapathy S, Alisafaei F, Radhakrishnan AV, Sharma Jokhun D, Shenoy VB, Shivashankar GV. Damodaran K, et al. Mol Biol Cell. 2018 Dec 1;29(25):3039-3051. doi: 10.1091/mbc.E18-04-0256. Epub 2018 Sep 26. Mol Biol Cell. 2018. PMID: 30256731 Free PMC article. - A Three-Dimensional Culture Model of Reversibly Quiescent Myogenic Cells.
Aguanno S, Petrelli C, Di Siena S, De Angelis L, Pellegrini M, Naro F. Aguanno S, et al. Stem Cells Int. 2019 Nov 11;2019:7548160. doi: 10.1155/2019/7548160. eCollection 2019. Stem Cells Int. 2019. PMID: 31827532 Free PMC article. - Prx1 + and Hic1+ Mesenchymal Progenitors Are Present Within the Epidural Fat and Dura Mater and Participate in Dural Injury Repair.
Shah S, Mudigonda S, Underhill TM, Salo PT, Mitha AP, Krawetz RJ. Shah S, et al. Stem Cells Transl Med. 2022 Mar 17;11(2):200-212. doi: 10.1093/stcltm/szab014. Stem Cells Transl Med. 2022. PMID: 35259263 Free PMC article. - The paradox of metabolism in quiescent stem cells.
Coller HA. Coller HA. FEBS Lett. 2019 Oct;593(20):2817-2839. doi: 10.1002/1873-3468.13608. Epub 2019 Sep 27. FEBS Lett. 2019. PMID: 31531979 Free PMC article. Review.
References
- Williams JG, Penman S. The messenger RNA sequences in growing and resting mouse fibroblasts. Cell. 1975;6:197–206. - PubMed
- Schneider C, King RM, Philipson L. Genes specifically expressed at growth arrest of mammalian cells. Cell. 1988;54:787–793. - PubMed
- Coppock DL, Kopman C, Scandalis S, Gilleran S. Preferential gene expression in quiescent human lung fibroblasts. Cell Growth Differ. 1993;4:483–493. - PubMed
- Coppock D, Kopman C, Gudas J, Cina-Poppe DA. Regulation of the quiescence-induced genes: Quiescin Q6, decorin, and ribosomal protein S29. Biochem Biophys Res Commun. 2000;269:604–610. - PubMed
- Iyer VR, Eisen MB, Ross DT, Schuler G, Moore T, et al. The transcriptional program in the response of human fibroblasts to serum. Science. 1999;283:83–87. - PubMed
Publication types
MeSH terms
Substances
LinkOut - more resources
Full Text Sources
Other Literature Sources
