A structural model for the large subunit of the mammalian mitochondrial ribosome - PubMed (original) (raw)
A structural model for the large subunit of the mammalian mitochondrial ribosome
Jason A Mears et al. J Mol Biol. 2006.
Abstract
Protein translation is essential for all forms of life and is conducted by a macromolecular complex, the ribosome. Evolutionary changes in protein and RNA sequences can affect the 3D organization of structural features in ribosomes in different species. The most dramatic changes occur in animal mitochondria, whose genomes have been reduced and altered significantly. The RNA component of the mitochondrial ribosome (mitoribosome) is reduced in size, with a compensatory increase in protein content. Until recently, it was unclear how these changes affect the 3D structure of the mitoribosome. Here, we present a structural model of the large subunit of the mammalian mitoribosome developed by combining molecular modeling techniques with cryo-electron microscopic data at 12.1A resolution. The model contains 93% of the mitochondrial rRNA sequence and 16 mitochondrial ribosomal proteins in the large subunit of the mitoribosome. Despite the smaller mitochondrial rRNA, the spatial positions of RNA domains known to be involved directly in protein synthesis are essentially the same as in bacterial and archaeal ribosomes. However, the dramatic reduction in rRNA content necessitates evolution of unique structural features to maintain connectivity between RNA domains. The smaller rRNA sequence also limits the likelihood of tRNA binding at the E-site of the mitoribosome, and correlates with the reduced size of D-loops and T-loops in some animal mitochondrial tRNAs, suggesting co-evolution of mitochondrial rRNA and tRNA structures.
Figures
Figure 1
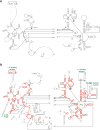
rRNA secondary structure comparison. a. Bos taurus mitochondrial rRNA secondary structure based on comparative sequence analysis. b. Secondary structure of H. marismortui 23S rRNA. Regions that align with the mitochondrial rRNA are highlighted in red, and those that are absent in the mitoribosome are shown in black. Some relevant functional regions are labeled (green), and six domains of the 23S rRNA are identified with roman numerals.
Figure 2
Rigid-body refinement of the rRNA model. Fifty-two independent rigid units were defined for refinement of the RNA structure using Monte Carlo with simulated annealing (see methods). Regions are colored to represent the distinct units that were used for the refinement. Unmodeled regions are represented as dashed, grey lines. Helices 13, 50 and 59.1, proposed by comparative sequence analysis (
), did not fit the EM density. We propose an alternate structure in the region with helices 50 and 59.1 in domain III (see Figs. 3 and 4).
Figure 3
Proposed secondary structure for the mammalian mitochondrial LSU rRNA. The structure is presented as modeled with regions predicted by comparative sequence analysis (blue) comprising roughly 86% of the secondary structure. Additional secondary structure was predicted using mfold (orange) to extend the structure for regions where comparative analysis does not predict secondary structure. Alifold was used to predict an alternate secondary structure in domain III (green) which differs slightly from that predicted by comparative analysis, but more closely matches the cryo-EM density.
Figure 4
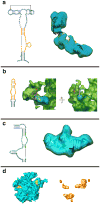
Additional and alternate secondary structures predicted using thermodynamic and comparative methods. The left side of each panel shows the predicted secondary structure, colored as in Fig. 3, and the right side of each panel shows the fit to the corresponding region in the cryo-EM density map.a. The L11-BD, where additional structure is predicted for the adjacent sequence (orange) using thermodynamic predictions from mfold.b. The L1-BD, where additional pairing is predicted using mfold for the rRNA sequence that interacts with MRP-L1 (red). A large globular mass of unidentified protein(s) (marked by * on the semitransparent green density) may restrict the movement of the L1 region in the mitoribosome. c. The domain III region where an alternate secondary was predicted using Alifold. This structure differs from that predicted by comparative sequence analysis (Fig. 1a) and fits the corresponding cryo-EM density much better (not shown). d. The cryo-EM density for the large mitoribosome subunit is shown in blue (interface view). The three regions that have been modeled using additional and alternative folding predictions are shown in orange and labeled a, b and c to correspond with the preceding panels.
Figure 5
Three-dimensional model for the mitochondrial 16S rRNA. a. The 16S rRNA is represented from the interface and solvent-accessible sides of the structure and colored by domain (I – purple, II – dark blue, III – orange, IV – green, V – red and VI – yellow). b. The model fit to EM density that is attributable to RNA, except for the tip of a domain V helix that contacts the L1 protein. However, the model of the extended rRNA segment fits into the complete LSU map (also see Fig. 4b). Coloring is the same as in panel a.
Figure 6
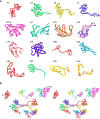
Structural homology models for MRPs. a. Models of the sixteen MRPs that have significant sequence similarity with bacterial ribosomal proteins that have been structurally characterized by X-ray crystallography. b. Structural organization of proteins in the large mitochondrial subunit fit to the cryo-EM density (stereo view).
Figure 7
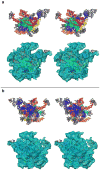
Stereo-view representation of the three-dimensional model of the 39S subunit of the mitochondrial ribosome. a. The interface view of the subunit shows that the conserved interface of the mitochondrial ribosome is still dominated by rRNA structure (colored as in Fig. 5). b. The homologous MRPs (grey) are predominantly located towards the solvent-accessible side of the particle. Upper and lower panels in both sections show the modeled structure (rRNA and proteins), and its fitting into the cryo-EM map, respectively.
Figure 8
Interactions with the tRNA binding sites of the mitoribosome. The A-, P- and E-site tRNAs are represented with the structure from yeast tRNA-Phe. Interactions with rRNA sequence that were found in the X-ray crystal structure of the T. thermophilus 70S particle are represented as either being conserved (red) or absent (yellow) in the mitochondrial ribosome.
Figure 9
Three-dimensional models of mitochondrial and archaeal large ribosomal subunit rRNAs. Models are shown from the subunit-interface side (left) and from the solvent side (right). a. Mitochondrial rRNA, showing a dramatic reduction compared to archaea. b. H. marismortui rRNA from X-ray crystallography. The L1-arm (L1) was modeled using structural data from other crystallographic structures., The A-site finger (blue RNA helix adjacent to *) was modeled using sequence data and cryo-EM density from E. coli. Six domains in both models (a and b) are identified by different colors: I (purple), II (dark blue), III (orange), IV (green), V (red) and VI (light blue). The 5S rRNA in the archaeon (yellow) is absent in the mitoribosome. L1 proteins for both models are shown with space-filling representations (grey).
Figure 10
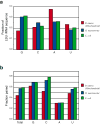
Sequence composition of LSU rRNAs from Bos taurus mitochondrion (red), H. marismortui (blue) and E. coli (green). a. The mitochondrial rRNA exhibits a significant reduction in guanine (G) content and increase in adenine (A) content relative to H. marismortui (an archaeon) and E. coli (a eubacterium). b. The base paired fractions for each species. The frequency of base pairing is substantially lower in the mitochondrial ribosome, especially for cytosine.
Similar articles
- Structural compensation for the deficit of rRNA with proteins in the mammalian mitochondrial ribosome. Systematic analysis of protein components of the large ribosomal subunit from mammalian mitochondria.
Suzuki T, Terasaki M, Takemoto-Hori C, Hanada T, Ueda T, Wada A, Watanabe K. Suzuki T, et al. J Biol Chem. 2001 Jun 15;276(24):21724-36. doi: 10.1074/jbc.M100432200. Epub 2001 Feb 21. J Biol Chem. 2001. PMID: 11279069 - The 3D arrangement of the 23 S and 5 S rRNA in the Escherichia coli 50 S ribosomal subunit based on a cryo-electron microscopic reconstruction at 7.5 A resolution.
Mueller F, Sommer I, Baranov P, Matadeen R, Stoldt M, Wöhnert J, Görlach M, van Heel M, Brimacombe R. Mueller F, et al. J Mol Biol. 2000 Apr 21;298(1):35-59. doi: 10.1006/jmbi.2000.3635. J Mol Biol. 2000. PMID: 10756104 - The 30S ribosomal P site: a function of 16S rRNA.
Noller HF, Hoang L, Fredrick K. Noller HF, et al. FEBS Lett. 2005 Feb 7;579(4):855-8. doi: 10.1016/j.febslet.2004.11.026. FEBS Lett. 2005. PMID: 15680962 Review. - The 55S mammalian mitochondrial ribosome and its tRNA-exit region.
Kaushal PS, Sharma MR, Agrawal RK. Kaushal PS, et al. Biochimie. 2015 Jul;114:119-26. doi: 10.1016/j.biochi.2015.03.013. Epub 2015 Mar 20. Biochimie. 2015. PMID: 25797916 Free PMC article. Review.
Cited by
- Distinct mechanisms of the human mitoribosome recycling and antibiotic resistance.
Koripella RK, Deep A, Agrawal EK, Keshavan P, Banavali NK, Agrawal RK. Koripella RK, et al. Nat Commun. 2021 Jun 14;12(1):3607. doi: 10.1038/s41467-021-23726-4. Nat Commun. 2021. PMID: 34127662 Free PMC article. - Genetic characteristics of complete mtDNA genome sequence of Indonesian local rabbit (Oryctolagus cuniculus).
Setiaji A, Lestari DA, Pandupuspitasari NS, Agusetyaningsih I, Khan FA. Setiaji A, et al. J Genet Eng Biotechnol. 2023 Oct 9;21(1):96. doi: 10.1186/s43141-023-00546-1. J Genet Eng Biotechnol. 2023. PMID: 37812313 Free PMC article. - Mitochondrial ribosome bL34 mutants present diminished translation of cytochrome c oxidase subunits.
Guedes-Monteiro RF, Ferreira-Junior JR, Bleicher L, Nóbrega FG, Barrientos A, Barros MH. Guedes-Monteiro RF, et al. Cell Biol Int. 2018 Jun;42(6):630-642. doi: 10.1002/cbin.10913. Epub 2017 Dec 7. Cell Biol Int. 2018. PMID: 29160602 Free PMC article. - Analysis of complete mitochondrial genome sequences increases phylogenetic resolution of bears (Ursidae), a mammalian family that experienced rapid speciation.
Yu L, Li YW, Ryder OA, Zhang YP. Yu L, et al. BMC Evol Biol. 2007 Oct 24;7:198. doi: 10.1186/1471-2148-7-198. BMC Evol Biol. 2007. PMID: 17956639 Free PMC article.
References
- Attardi G. Animal mitochondrial DNA: an extreme example of genetic economy. Int Rev Cytol. 1985;93:93–145. - PubMed
- Chomyn A, Cleeter MW, Ragan CI, Riley M, Doolittle RF, Attardi G. URF6, last unidentified reading frame of human mtDNA, codes for an NADH dehydrogenase subunit. Science. 1986;234:614–8. - PubMed
- Brenner C, Kroemer G. Apoptosis. Mitochondria--the death signal integrators. Science. 2000;289:1150–1. - PubMed
- Wallace DC. Mitochondrial diseases in man and mouse. Science. 1999;283:1482–8. - PubMed
- Kurland CG. Evolution of mitochondrial genomes and the genetic code. Bioessays. 1992;14:709–14. - PubMed
Publication types
MeSH terms
Substances
Grants and funding
- GM 61576/GM/NIGMS NIH HHS/United States
- R01 GM061576/GM/NIGMS NIH HHS/United States
- R01 GM053827/GM/NIGMS NIH HHS/United States
- R01 GM067317-03/GM/NIGMS NIH HHS/United States
- R01 GM067317/GM/NIGMS NIH HHS/United States
- GM 67317/GM/NIGMS NIH HHS/United States
- GM 53827/GM/NIGMS NIH HHS/United States
LinkOut - more resources
Full Text Sources
