Cortical and subcortical contributions to Stop signal response inhibition: role of the subthalamic nucleus - PubMed (original) (raw)
Comparative Study
Cortical and subcortical contributions to Stop signal response inhibition: role of the subthalamic nucleus
Adam R Aron et al. J Neurosci. 2006.
Abstract
Suppressing an already initiated manual response depends critically on the right inferior frontal cortex (IFC), yet it is unclear how this inhibitory function is implemented in the motor system. It has been suggested that the subthalamic nucleus (STN), which is a part of the basal ganglia, may play a role because it is well placed to suppress the "direct" fronto-striatal pathway that is activated by response initiation. In two experiments, we investigated this hypothesis with functional magnetic resonance imaging and a Stop-signal task. Subjects responded to Go signals and attempted to inhibit the initiated response to occasional Stop signals. In experiment 1, Going significantly activated frontal, striatal, pallidal, and motor cortical regions, consistent with the direct pathway, whereas Stopping significantly activated right IFC and STN. In addition, Stopping-related activation was significantly greater for fast inhibitors than slow ones in both IFC and STN, and activity in these regions was correlated across subjects. In experiment 2, high-resolution functional and structural imaging confirmed the location of Stopping activation within the vicinity of the STN. We propose that the role of the STN is to suppress thalamocortical output, thereby blocking Go response execution. These results provide convergent data for a role for the STN in Stop-signal response inhibition. They also suggest that the speed of Go and Stop processes could relate to the relative activation of different neural pathways. Future research is required to establish whether Stop-signal inhibition could be implemented via a direct functional neuroanatomic projection between IFC and STN (a "hyperdirect" pathway).
Figures
Figure 1.
A basal-ganglia model and the Stop-signal paradigm. A, An influential model proposes three pathways through the basal ganglia (direct, indirect, and hyperdirect). SNr, Substantia nigra; THAL, thalamus; STR, striatum. Open arrows are excitatory (glutamatergic); filled arrows are inhibitory (GABAergic). Figure adapted from Nambu et al. (2002).B, The Stop-signal paradigm consists of Go- and Stop-signal trials. On Go trials, the subject has 1 s (the hold period) to make a left or right button press in response to the stimulus. As soon as the subject responds (reaction time), the stimulus is replaced by a blank screen for a variable period of time (1 s − RT = jitter time, where jitter ranges between 0.5 and 4 s, mean of 1 s). On a Stop trial, a tone is played at some delay (SSD) after the arrow stimulus. If the response is inhibited, the arrow remains for 1 s, followed by the blank screen jitter period; if the subject does not inhibit (i.e., responds), then the timing is the same as the Go trial. SSD changes dynamically throughout the experiment to produce a 50% inhibition rate (see Materials and Methods). C, SSRT is estimated using the race model (Logan and Cowan, 1984). This assumes that Go and Stop processes are in a race and are independent of each other. The independence assumption implies that the distribution of Go processes on Stop trials (whether a response is made or not) is the same as the observed distribution of Go responses (when there is no Stop signal). On Stop trials, a tone occurs at some delay, the SSD after the Stop signal. If this delay is short, then P(inhibit) is high and this is likely to be a StopInhibit trial; if the delay is long, then P(inhibit) is low and this is likely to be a StopRespond trial. If SSD is varied so that P(inhibit)=0.5, then SSRT can be estimated by subtracting the SSD from the median value of the Go distribution.
Figure 2.
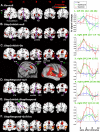
Activated networks for Going and Stopping and key peristimulus time courses for the hemodynamic response. Images are in neurological format (right = right). Activations are overlaid on coronal slices from the SPM single-subject structural template. All maps are thresholded at t > 3.05 voxel level,p < 0.05 cluster corrected for whole brain.A, Go trials activate contralateral motor cortex (M1), SMA, bilateral putamen (PUT), and left thalamus/pallidum, consistent with a fronto-striatal pathway. B, StopInhibit trials activate auditory cortex, parietal cortex, right STN, medial frontal cortex, bilateral putamen, and bilateral orbital/insula cortex extending into the opercular IFC in the right hemisphere. These activations include those associated with preparing to execute a Go response as well as the response inhibition network revealed, more precisely, by the contrast of StopInhibit–Go (C). This network includes right-lateralized STN, IFC, GP, and pre-SMA (also shown on saggital and surface rendered images). This network is also activated on StopRespond trials (D). E, StopInhibit trials activate bilateral putamen more than StopRespond, but this is not the case for StopRespond–GoTrim (F), which contrasts trials on which the subject tried to stop, but could not, with trials on the which the subject did not try, while controlling for response speed. On the right of the figure are shown peristimulus plots (with SEs) for different trial types for key foci. For these, mean activation for each subject was extracted from a sphere (radius, 4 mm) centered on the peak group-activated voxel. Note the differential effects of Go, StopInhibit, and StopRespond on the time course of the estimated BOLD response in left motor cortex in particular (inset, top right): StopInhibit trials have a delayed response, whereas StopRespond trials peak at the same time and amplitude as Go trials but then show a strong undershoot as if the inhibition occurred too late. Surface rendering for the lateral view was created by mapping the group-averaged fMRI data into a population-averaged surface atlas using multifiducial mapping (Van Essen, 2005). Thal, Thalamus; acc, anterior cingulate cortex; ctx, cortex.
Figure 3.
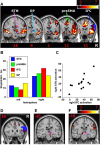
ROI analyses for experiment 1. B, StopInhibit–Go activation shown overlaid on anatomically defined IFC, pre-SMA, GP, and STN ROIs. The ROIs are color-coded. IFC pre-SMA and GP were defined from the AAL template (Tzourio-Mazoyer et al., 2002) and the STN according to the atlas by Lucerna et al. (2002). Activation is significant_p_ < 0.05 corrected for whole-brain multiple comparisons.A, The response inhibition network made up of IFC, pre-SMA, GP, and STN is significantly more active in the right than left hemisphere. For each subject, the mean value for all voxels in each anatomically defined ROI was computed for the contrast of StopInhibit–Go. All ROIs (except GP) showed significantly greater activation in the right hemisphere than the left (all p < 0.005; Bonferroni’s corrected).C, Across subjects, mean activation in right STN and right IFC was significantly correlated (for StopInhibit–Go contrast).D, E, Subjects who inhibit more quickly activate right IFC and STN more. StopInhibit–Go activation is significantly greater for subjects with fast SSRT versus those with slow SSRT (independent samples t test) in right IFC (MNI: 42, 26, 14; t = 7.26; p = 0.005, SVC) and right STN (MNI: 8, −20, −4; t = 3.48; p = 0.051, SVC). F, When inhibition occurs later, STN is more active. For StopInhibit–Go, activation in right STN increases parametrically with increasing SSD (MNI: 6, −18, −2;t = 3.42; p = 0.028, one-tailed, SVC). The_y_ coordinate in MNI space is shown above each coronal slice. The color scale represents t score. R, Right.
Figure 4.
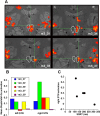
Subthalamic nucleus region is significantly activated by response inhibition in high-resolution experiment 2. A, Individual subject activation maps. StopInhibit–Go activation is shown for four subjects (the 5th did not activate at this or any threshold). Activation is overlaid on each subject’s T2-weighted structural scan. Images are in neurological format (L = L). For display purposes, individual subject maps were thresholded at_z_ > 1.9 and p < 0.05 whole-brain cluster correction. Bilateral subthalamic nuclei are visible as hypointense (dark) regions in the midbrain (Dormont et al., 2004), demarcated by white lines. Activation of STN is evidently right-lateralized. There is also activation of bilateral auditory cortex in response to binaural Stop tone for all subjects. B, Mean activation within STN in each hemisphere. _z_-values for each subject, for the contrast StopInhibit–Go, were averaged within the entire hypointense STN region, for left and right hemispheres separately. As a group, the activation within right STN was significant (t(4) = 2.65; p < 0.05, one-tailed). There was a trend for right STN activation to be greater than left STN (t(4) = 1.57; p = 0.10, one-tailed). C, Activation within right STN correlated with SSRT: those subjects who inhibit more quickly activate more, but the small sample size precluded assessing this relationship statistically. L, Left; R, right.
Similar articles
- Effective connectivity reveals important roles for both the hyperdirect (fronto-subthalamic) and the indirect (fronto-striatal-pallidal) fronto-basal ganglia pathways during response inhibition.
Jahfari S, Waldorp L, van den Wildenberg WP, Scholte HS, Ridderinkhof KR, Forstmann BU. Jahfari S, et al. J Neurosci. 2011 May 4;31(18):6891-9. doi: 10.1523/JNEUROSCI.5253-10.2011. J Neurosci. 2011. PMID: 21543619 Free PMC article. - Stop-signal reaction-time task performance: role of prefrontal cortex and subthalamic nucleus.
Eagle DM, Baunez C, Hutcheson DM, Lehmann O, Shah AP, Robbins TW. Eagle DM, et al. Cereb Cortex. 2008 Jan;18(1):178-88. doi: 10.1093/cercor/bhm044. Epub 2007 May 20. Cereb Cortex. 2008. PMID: 17517682 - Subcortical processes of motor response inhibition during a stop signal task.
Li CS, Yan P, Sinha R, Lee TW. Li CS, et al. Neuroimage. 2008 Jul 15;41(4):1352-63. doi: 10.1016/j.neuroimage.2008.04.023. Epub 2008 Apr 11. Neuroimage. 2008. PMID: 18485743 Free PMC article. - Frontosubthalamic Circuits for Control of Action and Cognition.
Aron AR, Herz DM, Brown P, Forstmann BU, Zaghloul K. Aron AR, et al. J Neurosci. 2016 Nov 9;36(45):11489-11495. doi: 10.1523/JNEUROSCI.2348-16.2016. J Neurosci. 2016. PMID: 27911752 Free PMC article. Review. - Inhibition and impulsivity: behavioral and neural basis of response control.
Bari A, Robbins TW. Bari A, et al. Prog Neurobiol. 2013 Sep;108:44-79. doi: 10.1016/j.pneurobio.2013.06.005. Epub 2013 Jul 13. Prog Neurobiol. 2013. PMID: 23856628 Review.
Cited by
- Dissociable dorsal and ventral frontostriatal working memory circuits: evidence from subthalamic stimulation in Parkinson's disease.
Ventre-Dominey J, Bourret S, Mollion H, Broussolle E, Dominey PF. Ventre-Dominey J, et al. Hum Brain Mapp. 2014 Feb;35(2):552-66. doi: 10.1002/hbm.22205. Epub 2012 Oct 25. Hum Brain Mapp. 2014. PMID: 23097317 Free PMC article. - How to stop or change a motor response: Laplacian and independent component analysis approach.
Rangel-Gomez M, Knight RT, Krämer UM. Rangel-Gomez M, et al. Int J Psychophysiol. 2015 Sep;97(3):233-44. doi: 10.1016/j.ijpsycho.2015.01.012. Epub 2015 Feb 7. Int J Psychophysiol. 2015. PMID: 25660306 Free PMC article. - Patterns of Focal- and Large-Scale Synchronization in Cognitive Control and Inhibition: A Review.
Beppi C, Violante IR, Hampshire A, Grossman N, Sandrone S. Beppi C, et al. Front Hum Neurosci. 2020 Jun 25;14:196. doi: 10.3389/fnhum.2020.00196. eCollection 2020. Front Hum Neurosci. 2020. PMID: 32670035 Free PMC article. Review. - Strength in cognitive self-regulation.
Barutchu A, Carter O, Hester R, Levy N. Barutchu A, et al. Front Psychol. 2013 Apr 11;4:174. doi: 10.3389/fpsyg.2013.00174. eCollection 2013. Front Psychol. 2013. PMID: 23596430 Free PMC article. - Altered inhibition-related frontolimbic connectivity in obsessive-compulsive disorder.
van Velzen LS, de Wit SJ, Ćurĉić-Blake B, Cath DC, de Vries FE, Veltman DJ, van der Werf YD, van den Heuvel OA. van Velzen LS, et al. Hum Brain Mapp. 2015 Oct;36(10):4064-75. doi: 10.1002/hbm.22898. Epub 2015 Jul 15. Hum Brain Mapp. 2015. PMID: 26183689 Free PMC article.
References
- Alexander G, Crutcher M, DeLong M (1990). Basal ganglia-thalomocortical circuits: parallel substrates for motor, oculomotor, “prefrontal” and “limbic” functions. Prog Brain Res 85:119–146. - PubMed
- Aron AR (2003). The neural basis of inhibitory mechanisms in executive function. PhD thesis University of Cambridge.
- Aron AR, Poldrack RA (2005). The cognitive neuroscience of response inhibition: relevance for genetic research in attention-deficit/hyperactivity disorder. Biol Psychiatry 57:1285–1292. - PubMed
- Aron AR, Fletcher PC, Bullmore ET, Sahakian BJ, Robbins TW (2003a). Stop-signal inhibition disrupted by damage to right inferior frontal gyrus in humans. Nat Neurosci 6:115–116. - PubMed
- Aron AR, Dowson J, Sahakian BJ, Robbins TW (2003b). Methylphenidate improves response inhibition in adults with attention deficit/hyperactivity disorder. Biol Psychol 54:1465–1468. - PubMed
Publication types
MeSH terms
Substances
LinkOut - more resources
Full Text Sources


