The APC tumor suppressor counteracts beta-catenin activation and H3K4 methylation at Wnt target genes - PubMed (original) (raw)
Comparative Study
The APC tumor suppressor counteracts beta-catenin activation and H3K4 methylation at Wnt target genes
Jose Sierra et al. Genes Dev. 2006.
Abstract
The APC tumor suppressor controls the stability and nuclear export of beta-catenin (beta-cat), a transcriptional coactivator of LEF-1/TCF HMG proteins in the Wnt/Wg signaling pathway. We show here that beta-cat and APC have opposing actions at Wnt target genes in vivo. The beta-cat C-terminal activation domain associates with TRRAP/TIP60 and mixed-lineage-leukemia (MLL1/MLL2) SET1-type chromatin-modifying complexes in vitro, and we show that beta-cat promotes H3K4 trimethylation at the c-Myc gene in vivo. H3K4 trimethylation in vivo requires prior ubiquitination of H2B, and we find that ubiquitin is necessary for transcription initiation on chromatin but not nonchromatin templates in vitro. Chromatin immunoprecipitation experiments reveal that beta-cat recruits Pygopus, Bcl-9/Legless, and MLL/SET1-type complexes to the c-Myc enhancer together with the negative Wnt regulators, APC, and betaTrCP. Interestingly, APC-mediated repression of c-Myc transcription in HT29-APC colorectal cancer cells is initiated by the transient binding of APC, betaTrCP, and the CtBP corepressor to the c-Myc enhancer, followed by stable binding of the TLE-1 and HDAC1 corepressors. Moreover, nuclear CtBP physically associates with full-length APC, but not with mutant SW480 or HT29 APC proteins. We conclude that, in addition to regulating the stability of beta-cat, APC facilitates CtBP-mediated repression of Wnt target genes in normal, but not in colorectal cancer cells.
Figures
Figure 1.
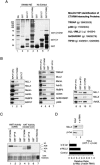
Identification of proteins that bind to the β-cat CTARM domain in GST-pulldown experiments carried out using SW480CRC nuclear extracts. (A) SDS-PAGE analysis of the proteins bound to GST-CTARM (lane 4), GST-CT (lane 3), and GST (lane 2) after incubation with SW480 nuclear extract, or of GST-CTARM (lane 7), GST-CT (lane 6), or GST (lane 5) proteins in the absence of extract; proteins were visualized by silver stain. The GI protein accession numbers of the CTARM-interacting proteins identified by MALDI-TOF are listed at the right. (B, left) Immunoblot analysis of HeLa nuclear proteins bound to either GST-CTARM (lane 2) or GST-CT (control; lane 3) beads. For comparison, 2% of each input extract is shown in lane 1. (Middle) Immunoblot comparison of SW480 nuclear proteins bound to GST-CTARM (lane 5), GST (control, lane 6), or GST-VP16 activation domain (lane 7). The input SW480 nuclear extract is shown in lane 4. (Right) Analysis of MLL1, MLL2, and Ash2L in SW40 nuclear extract (input, lane 8) or bound to GST-β-cat-FL (lane 9), GST-CTARM (lane 10) or GST (lane 11) beads. (C) Analysis of HMT (lanes 1–3) or HAT (lanes 4–6) activities present in the GST-CTARM (lanes 1,4), GST (lanes 3,6), or GST-VP16 (lanes 2,5) pulldown fractions. The input core histones are shown in lane 7. (Bottom) The core histones in each reaction were visualized by Coomassie stain. (D) Analysis of exogenous β-cat:LEF-1 activation of the endogenous c-Myc gene in HeLa cells transfected with siRNAs against β-cat or MLL2. The inset shows an immunoblot of MLL2 and β-cat protein levels in control cells (lane 1), or cells expressing the siRNA targeted to each protein (lane 2).
Figure 2.
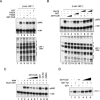
Ubiquitin is required for β-cat:LEF-1 transcription of chromatin templates in vitro. (A) The CUE domain competes for transcription on chromatin in vitro. Primer-extension analysis of RNA from a chromatin-assembled LEF-1 reporter gene (pBRE) in the presence (lanes 2–6) or absence (lane 1) of 120 nM recombinant ΔN β-cat protein. Recombinant LEF-1 (ΔAD; 120 nM) was present in all reactions, and the α-globin (α-glo) gene was added as a control for nonchromatin (DNA) transcription. Where indicated, reactions contained 15 μg (2.5 μM) each of GST-CUE (lane 3), GST-CUE-F420A (lane 4), GST-CUE-P421A (lane 5), or GST alone (lane 6). Lanes 7–12 show DNase I footprint analyses of the binding of β-cat:LEF-1 in reactions 1–6, respectively. (B) Ubiquitin rescues the inhibitory effect of GST-CUE on β-cat-regulated transcription in vitro. (Top) Primer extension analysis of pBRE and α-glo (control) RNA in reactions containing (lanes 2–10) or lacking (lane 1) recombinant β-cat and LEF-1. Where indicated, reactions contained low (2.5 μM, lanes 3,7,8) or high (10 μM, lane 4) levels of GST-CUE, or low (2.5 μM, lanes 5,9,10) or high (10 μM, lane 6) GST control, in either the absence of exogenous ubiquitin (lanes 1–6) or in the presence of either 1 μM (lanes 7,9) or 10 μM (lanes 8,10) of His-tagged ubiquitin. (C) The GST-CUE domain blocks Notch enhancer activation of chromatin templates in vitro. Where indicated, reactions contained (lanes 2–10) or lacked (lane 1) the recombinant Notch intracellular domain (NICD) and CBF1 DNA-binding protein. Reactions 3–10 also contained the Notch coactivator Mastermind (MAM). GST-CUE levels were 170 nM (lane 4), 830 nM (lane 5), 1.7 μM (lane 6), and 3.3 μM (lane 7), and the GST control was added at 5.3 μM (lane 8). Ubiquitin aldehyde (1.8 nM) and MG132 (4 nM) in DMSO were present in lane 9, and the DMSO alone was tested as a control in lane 10. RNA synthesized from the CBF1-dependent promoter was analyzed by primer extension; α-glo was added as a control for nonchromatin transcription. (D) The CUE domain does not block HIV-1 Tat-regulated transcription initiation or elongation on the HIV-1 promoter DNA in vitro. HIV-1 RNA was analyzed by the run-off elongation assay in the presence of GST-Tat (lanes 2,4–6), GST-CUE (lanes 3–6), or GST alone (lanes 1,3).
Figure 3.
ChIP analysis of β-cat induction of murine c-Myc transcription in lithium-treated C2C12 cells. (A, left, lanes 1–6) RT–PCR analysis of c-Myc RNA in C2C12 cells treated with 10 mM LiCl for the times indicated above each lane; β-actin mRNA levels were monitored as a control. (Right, lanes 7–12) The levels of β-cat, Pygo, and LEF-1 in the lithium-treated C2C12 cells were monitored by immunoblot. (B) ChIP analysis of the c-Myc enhancer at different times following induction of β-cat by exposure of cells to 10 mM LiCl. The primers used to monitor the upstream LEF-1 sites in the mouse c-Myc gene enhancer are indicated in the schematic diagram relative to the P1 RNA start site (+1). (Lanes 1–6) A distal (10 Kb) upstream region was monitored as a control. Lanes 7–12 show the transcription factor binding to the Wnt-responsive c-Myc enhancer (ref). (C) ChIP analysis of MLL2 and SET1-type complex subunits at the c-Myc enhancer following exposure to 10 mM LiCl for the times indicated above each lane. (D) Quantitative PCR analysis of some of the ChIP samples shown in B and C. In each graph, the kinetics of β-cat localization to the c-Myc enhancer (shown in green) is compared with the specific transcription factor indicated at the bottom of each panel.
Figure 4.
Analysis of APC-induced shut-off of human c-Myc gene transcription in the HT29-APC CRC cell line. (A, top, lanes 1–7) RT–PCR analysis of the induction of APC-FL mRNA in HT29-APC cells after exposure to ZnCl2 for different times (in minutes), as indicated above each lane. RT–PCR analysis of β-actin mRNA is shown below as a control. (Middle, lanes 8–15) RT–PCR analysis of the decline in c-Myc mRNA levels in the ZnCl2-treated HT29-APC cells, with times of exposure to ZnCl2 (in hours) indicated above each lane. RT–PCR analysis of β-actin mRNA is shown as a control. (Bottom, lanes 16–22) RT–PCR analysis of c-Myc, APC-FL, and β-actin mRNA levels in the control HT29-β-Gal cells, which were exposed to ZnCl2 for the times indicated above each lane. (B, lanes 1–5) Immunoblot analysis of steady-state levels of APC-FL, β-cat, and c-Myc proteins in extracts from HT29-APC cells treated with ZnCl2 for the different times (in hours) indicated above each lane. Levels of the Sp1 transcription factor are included as a control. (C) ChIP analysis of transcription factors bound to the c-Myc gene in HT29-β-Gal cells (lanes 1–7) or in HT29-APC cells (lanes 8–14) by exposure to ZnCl2 for the different amounts of time (in minutes) indicated above each lane. (D) ChIP analysis by RT–PCR for some of the same factors analyzed in C. Each panel analyzes transcription factor occupancy at the c-Myc enhancer in HT29-APC cells (blue) vs. the control HT29-β-Gal cells (red). FL-APC was detected with antisera specific to a C-terminal domain (APC-C), whereas the mutant APC protein was detected using an antisera specific to the N terminus of the protein (APC-N). (E) Re-ChIP analysis to test whether the mutant HT29 APC protein and endogenous β-catenin co-occupy the c-Myc enhancer in HT29 CRC cells. ChIP in HT29-β-Gal cells (without zinc) was first carried out using the α-β-cat antibody, and the immunocomplex was diluted in 10 mM dithiothreitol. Aliquots were then immunoprecipitated with α-APC (N terminus-specific) or α-LEF-1 antisera, and the precipitated chromatin was amplified by PCR using primers specific for the c-Myc enhancer.
Figure 5.
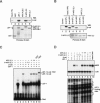
Analysis of the interactions between recombinant human β-cat and human LEF-1, human Bcl-9 (HD2 domain; amino acids 288–419), APC-A,B,C, or CKI-phosphorylated or unphosphorylated APC-2,3 proteins in vitro. The (human) APC fragments used here are APC-A,B,C, which contains all three 15-amino-acid repeats (amino acids 1100–1189), and APC-2,3, which contains the second and third 20-amino-acid repeat (amino acids 1362–1540; Xing et al. 2003). (A) CKI-phosphorylation of APC-2,3 enhances binding to β-cat in GST pulldown experiments carried out using SW480 nuclear extracts. SW480 nuclear extract was incubated with Glutathione-S-Sepharose 4B beads coupled to the following GST fusion proteins: GST-LEF-1, GST-APC-A,B,C, CKI-phosphorylated (P-APC) or unphosphorylated GST-APC-2,3, or GST (control), and examined for associated nuclear β-cat by Western blot after stringent washing of the beads. The β-cat in the SW480 extract (input, 1%) is shown in lane 1. The bead-coupled GST fusion proteins are visualized by Ponceau S stain as a loading control. (B) FL and ΔN β-catenin were produced by in vitro transcription and translation in a coupled reticulocyte lysate (Promega) and tested for binding to unphosphorylated (lanes 6,7) or CK1δ-phosphorylated (lanes 4,5) GST-APC-2,3. The proteins were visualized by Ponceau S stain in the bottom panel. (C) Phosphorylated APC-2,3 blocks binding of β-cat to LEF-1 in EMSA experiments in vitro. Recombinant LEF-1 (ΔAD; 1 μM) was present in lanes 2, and 4–10, and β-cat (ΔN; 1 μM) was present in lanes 3–10. Where indicated, reactions also contained 2 μM (lane 5) or 12 μM (lane 6) of CK1δ-phosphorylated GST-APC-2,3, or 2 μM (lane 7) or 12 μM (lane 8) GST-APC-2,3 (unphosphorylated), or 25 μM GST (lane 9) or GST-HD2 (lane 10). (D) CK1δ-phosphorylated APC blocks β-cat:LEF-1 transcription of the chromatin pBRE template in vitro. Reactions contained 100 or 600 nM of CK1δ-phosphorylated GST-APC-2,3 (lanes 4,5), or GST-APC-2,3 (unphosphorylated; lanes 6,7). The phosphorylated and unphosphorylated GST-APC-2,3 (100 nM) proteins were added after chromatin assembly was completed in the reactions shown in lanes 8 and 9, respectively.
Figure 6.
CtBP associates with full-length APC, but not with cancer-associated truncated APC proteins. (A) Coimmunoprecipitation of CtBP with full-length or mutant APC proteins was analyzed by immunoblot using nuclear extracts derived from 293T cells, SW480, or HT29 CRC cells, as indicated above each lane. (Lanes 1–3) APC was immunoprecipitated using an antibody specific to the N-terminal half of the protein, and any associated CtBP was detected by immunoblot. The input CtBP is shown (by immunoblot) in lanes 4–6, and the input APC proteins are shown (by immunoblot) in lanes 7–9. (B) Newly expressed full-length APC in HT29-APC cells associates with CtBP. HT29-APC and HT29-β-Gal cells were treated with 100 μM ZnCl2 to induce full-length APC expression, and association with CtBP was determined by immunoblot of anti-APC immunoprecipitates (lanes 1,2) or with control anti-IgG serum (lanes 5,6). The input CtBP protein in each extract is shown in lanes 3 and 4. A schematic of wild-type APC and the mutant HT29 APC is shown at the bottom. (S1–S3) Axin-binding sites.
Figure 7.
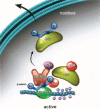
Model for the role of APC in the exchange of coactivator and corepressor complexes at Wnt target genes. At the active gene, β-cat interacts with Bcl-9:Pygo and with MLL1/MLL2 complexes to promote H3K4Me3. The APC tumor suppressor controls the switch between transcriptional coactivator and corepressor complexes, mediated through its ability to interact with CtBP. Phosphorylation of APC by GSK-3β and CK1 may induce APC to bind β-cat, and dislodge it from LEF-1. β-cat may then be exported from the nucleus as part of an APC complex, or, alternatively, it might be ubiquitinated by βTrCP for degradation at the DNA or elsewhere in the cell.
Similar articles
- The APC tumor suppressor binds to C-terminal binding protein to divert nuclear beta-catenin from TCF.
Hamada F, Bienz M. Hamada F, et al. Dev Cell. 2004 Nov;7(5):677-85. doi: 10.1016/j.devcel.2004.08.022. Dev Cell. 2004. PMID: 15525529 - Chromatin-specific regulation of LEF-1-beta-catenin transcription activation and inhibition in vitro.
Tutter AV, Fryer CJ, Jones KA. Tutter AV, et al. Genes Dev. 2001 Dec 15;15(24):3342-54. doi: 10.1101/gad.946501. Genes Dev. 2001. PMID: 11751639 Free PMC article. - α-Catenin interacts with APC to regulate β-catenin proteolysis and transcriptional repression of Wnt target genes.
Choi SH, Estarás C, Moresco JJ, Yates JR 3rd, Jones KA. Choi SH, et al. Genes Dev. 2013 Nov 15;27(22):2473-88. doi: 10.1101/gad.229062.113. Genes Dev. 2013. PMID: 24240237 Free PMC article. - Wnt signaling: is the party in the nucleus?
Willert K, Jones KA. Willert K, et al. Genes Dev. 2006 Jun 1;20(11):1394-404. doi: 10.1101/gad.1424006. Genes Dev. 2006. PMID: 16751178 Review. - Transcriptional Regulation of Wnt/β-Catenin Pathway in Colorectal Cancer.
Bian J, Dannappel M, Wan C, Firestein R. Bian J, et al. Cells. 2020 Sep 19;9(9):2125. doi: 10.3390/cells9092125. Cells. 2020. PMID: 32961708 Free PMC article. Review.
Cited by
- GRHL3/GET1 and trithorax group members collaborate to activate the epidermal progenitor differentiation program.
Hopkin AS, Gordon W, Klein RH, Espitia F, Daily K, Zeller M, Baldi P, Andersen B. Hopkin AS, et al. PLoS Genet. 2012;8(7):e1002829. doi: 10.1371/journal.pgen.1002829. Epub 2012 Jul 19. PLoS Genet. 2012. PMID: 22829784 Free PMC article. - Uncx regulates proliferation of neural progenitor cells and neuronal survival in the olfactory epithelium.
Sammeta N, Hardin DL, McClintock TS. Sammeta N, et al. Mol Cell Neurosci. 2010 Dec;45(4):398-407. doi: 10.1016/j.mcn.2010.07.013. Epub 2010 Aug 6. Mol Cell Neurosci. 2010. PMID: 20692344 Free PMC article. - The various roles of ubiquitin in Wnt pathway regulation.
Tauriello DV, Maurice MM. Tauriello DV, et al. Cell Cycle. 2010 Sep 15;9(18):3700-9. doi: 10.4161/cc.9.18.13204. Epub 2010 Sep 25. Cell Cycle. 2010. PMID: 20930545 Free PMC article. Review. - PTIP associates with MLL3- and MLL4-containing histone H3 lysine 4 methyltransferase complex.
Cho YW, Hong T, Hong S, Guo H, Yu H, Kim D, Guszczynski T, Dressler GR, Copeland TD, Kalkum M, Ge K. Cho YW, et al. J Biol Chem. 2007 Jul 13;282(28):20395-406. doi: 10.1074/jbc.M701574200. Epub 2007 May 11. J Biol Chem. 2007. PMID: 17500065 Free PMC article. - Beyond HAT Adaptor: TRRAP Liaisons with Sp1-Mediated Transcription.
Yin BK, Wang ZQ. Yin BK, et al. Int J Mol Sci. 2021 Nov 18;22(22):12445. doi: 10.3390/ijms222212445. Int J Mol Sci. 2021. PMID: 34830324 Free PMC article. Review.
References
- Bienz M. The subcellular destinations of APC proteins. Nat. Rev. Mol. Cell Biol. 2002;3:328–338. - PubMed
Publication types
MeSH terms
Substances
LinkOut - more resources
Full Text Sources
Other Literature Sources
Miscellaneous


