Large-scale trends in the evolution of gene structures within 11 animal genomes - PubMed (original) (raw)
Large-scale trends in the evolution of gene structures within 11 animal genomes
Mark Yandell et al. PLoS Comput Biol. 2006 Mar.
Abstract
We have used the annotations of six animal genomes (Homo sapiens, Mus musculus, Ciona intestinalis, Drosophila melanogaster, Anopheles gambiae, and Caenorhabditis elegans) together with the sequences of five unannotated Drosophila genomes to survey changes in protein sequence and gene structure over a variety of timescales--from the less than 5 million years since the divergence of D. simulans and D. melanogaster to the more than 500 million years that have elapsed since the Cambrian explosion. To do so, we have developed a new open-source software library called CGL (for "Comparative Genomics Library"). Our results demonstrate that change in intron-exon structure is gradual, clock-like, and largely independent of coding-sequence evolution. This means that genome annotations can be used in new ways to inform, corroborate, and test conclusions drawn from comparative genomics analyses that are based upon protein and nucleotide sequence similarities.
Conflict of interest statement
Competing interests. The authors have declared that no competing interests exist.
Figures
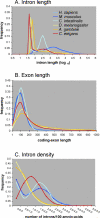
Figure 1. Global Overview of Gene Structure in Six Annotated Animal Genomes
(A) Intron length. Annotated intron length (log10) is plotted on the _x_-axis; the frequency at which introns of that length occur in an organism's genome is plotted on the _y_-axis. (B) Exon length. _x_-axis, coding-exon length in nucleotides; _y_-axis, frequency. (C) Intron density. A transcript's intron density is equal to its number of coding introns divided by the length of the protein it encodes. _y_-axis, frequency of annotated transcripts with a particular intron density. _x_-axis, intron density binned in increments of 0.5 introns/100 amino acid (see Materials and Methods). Deuterostomes are shown in shades of blue; protostomes in shades of red.
Figure 2. Cumulative Distribution Functions Illustrating Proteome-Wide Trends in Protein Similarity
_x_-axis, bits/aligned position; _y_-axis, cumulative fraction of HSPs having that number of bits/aligned amino acid pair or less. To facilitate display, only a subset of the 21 possible pair-wise combinations is shown. Data are based upon all reciprocal best BLASTP hits identified in all versus all BLASTP searches of the proteomes. Similarity calculations were restricted to the high-scoring HSP for each BLAST hit, in order to avoid data duplication due to overlapping alignments. There were 13,339 M. musculus–H. sapiens reciprocal best hits; 6,435 between D. melanogaster and A. gambiae; 5,828 between C. intestinalis and H. sapiens; 5,542 between D. melanogaster and H. sapiens; 4,669 between C. elegans and H. sapiens; 4,588 between C. elegans and D. melanogaster; 3,361 between H. sapiens and A. thaliana; and 2,835 between C. elegans and A. thaliana. atha, A. thaliana; cele, C. elegans; cint, C. intestinalis; dmel, D. melanogaster; hsap, H. sapiens; mmus, M. musculus.
Figure 3. Neighbor-Joining Trees Summarizing Proteome-Wide Trends in Protein Similarity and Genome-Wide Trends in Intron–Exon Structural Similarity
Proteome-wide trends in protein similarity (A), and genome-wide trends in intron–exon structural similarity (B). Numbers beneath tree nodes are bootstrap values.
Figure 4. Intron–Exon Structures Evolve Largely Independently of Protein Sequences
_x_-axis, human reciprocal best-hit best HSPs for four representative proteomes binned by percent identity in 5% increments. _y_-axis, percent of aligned introns among the HSPs in each bin. cele, C. elegans; cint, C. intestinalis; dmel, D. melanogaster; hsap, H. sapiens; mmus, M. musculus.
Figure 5. Controlling for the Impact of Unequal Rates of Protein Evolution on the Evolution of Intron–Exon Structures
(A) Unrooted neighbor-joining tree based upon amino acid similarities for reciprocal best-hit best HSPs having 1.25 bits/aligned amino acid pair. (B) Unrooted neighbor-joining tree based upon similarities in the intron–exon structures of those same HSPs.
Figure 6. Lengths of Orthologous Introns within a Quartet Are More Correlated than Those of Paralogous Introns
(A) Quartet orthologous intron pairs. _x_-axis, length (log10) of introns in human members of each quartet; _y_-axis, length (log10) of corresponding orthologous introns in the mouse member of the same quartet. Spearman correlation coefficient: 0.903; p < 0.001. (B) Paralogous introns. _x_-axis, length (log10) of introns in human members of each quartet; _y_-axis, length (log10) of corresponding paralogous introns in the other human member of the same quartet. Spearman correlation coefficient: 0.140; p < 0.001. The mouse distributions are essentially identical to their human counterparts.
Figure 7. D. melanogaster Intron Lengths Are Highly Correlated with Their Inferred D. pseudoobscura Orthologs; D. melanogaster Paralogous Introns Show No Such Correlation
(A) _x_-axis, length (log10) of annotated D. melanogaster introns; _y_-axis, length (log10) of their inferred orthologs in the D. pseudoobscura genome. Red circles indicate those introns containing a transposon in D. melanogaster; blue circles indicate those introns containing a transposon in D. pseudoobscura; gold circles indicate introns without identifiable transposons in either species. Spearman correlation coefficient: 0.637; p < 0.001. (B) Intron lengths of paralogs having the same intron–exon structure as judged by the positions of their splice junctions relative to the protein alignments of their reciprocal best-hit best HSPs. _x_-axis, length (log10) of introns in an annotated D. melanogaster gene; _y_-axis, length (log10) of corresponding paralogous introns. Spearman correlation coefficient: 0.448; p < 0.001.
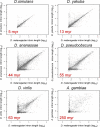
Figure 8. Correlation in Orthologous Intron Lengths Is Proportional to Time since Last Common Ancestor
From left to right, and top to bottom: Annotated D. melanogaster lengths (_x_-axis) versus inferred orthologous intron lengths (_y_-axis) for D. simulans (strain 6), D. yakuba, D. ananassae, D. pseudoobscura, and D. virilis. Bottom right-hand panel: Annotated D. melanogaster lengths (_x_-axis) versus inferred A. gambiae intron lengths (_y_-axis). Approximate time since last common ancestor is shown in red in the lower left-hand corner in each panel; these are approximate estimates based upon protein data [30]. Spearman correlation coefficients: 0.886, 0.863, 0.670, 0.637, 0.550, and 0.410 for D. simulans, D. yakuba, D. ananassae, D. pseudoobscura, D. virilis, and A. gambiae distributions, respectively. p < 0.001 for each correlation coefficient. See Materials and Methods for analysis details.
Figure 9. Intron Lengths Can Be Used as a Molecular Clock
_y_-axis, magnitude of the Spearman correlation coefficient for the five Drosophila distributions shown in Figure 8. _x_-axis, time (millions of years) since last common ancestor based on protein similarities as calculated in [30]. Black bars above and below each data point denote observed variance in the data and were obtained by randomly resampling 1,000 orthologous intron pairs 100 times. Best-fitting curve (shown in black) y = −0.0057x + 0.9266; R2 = 0.9875.
Similar articles
- Synaptotagmin gene content of the sequenced genomes.
Craxton M. Craxton M. BMC Genomics. 2004 Jul 6;5(1):43. doi: 10.1186/1471-2164-5-43. BMC Genomics. 2004. PMID: 15238157 Free PMC article. - Assessing the Drosophila melanogaster and Anopheles gambiae genome annotations using genome-wide sequence comparisons.
Jaillon O, Dossat C, Eckenberg R, Eiglmeier K, Segurens B, Aury JM, Roth CW, Scarpelli C, Brey PT, Weissenbach J, Wincker P. Jaillon O, et al. Genome Res. 2003 Jul;13(7):1595-9. doi: 10.1101/gr.922503. Genome Res. 2003. PMID: 12840038 Free PMC article. - Developmental biologists cast a net over sequenced genomes.
Gerberding M, Patel NH. Gerberding M, et al. Genome Biol. 2002 Sep 24;3(10):REPORTS4032. doi: 10.1186/gb-2002-3-10-reports4032. Epub 2002 Sep 24. Genome Biol. 2002. PMID: 12374573 Free PMC article. - The Ciona intestinalis genome: when the constraints are off.
Holland LZ, Gibson-Brown JJ. Holland LZ, et al. Bioessays. 2003 Jun;25(6):529-32. doi: 10.1002/bies.10302. Bioessays. 2003. PMID: 12766941 Review. - Transcendent elements: whole-genome transposon screens and open evolutionary questions.
Holmes I. Holmes I. Genome Res. 2002 Aug;12(8):1152-5. doi: 10.1101/gr.453102. Genome Res. 2002. PMID: 12176921 Review. No abstract available.
Cited by
- Accelerated evolutionary rate of housekeeping genes in tunicates.
Tsagkogeorga G, Turon X, Galtier N, Douzery EJ, Delsuc F. Tsagkogeorga G, et al. J Mol Evol. 2010 Aug;71(2):153-67. doi: 10.1007/s00239-010-9372-9. Epub 2010 Aug 10. J Mol Evol. 2010. PMID: 20697701 - Quantitative measures for the management and comparison of annotated genomes.
Eilbeck K, Moore B, Holt C, Yandell M. Eilbeck K, et al. BMC Bioinformatics. 2009 Feb 23;10:67. doi: 10.1186/1471-2105-10-67. BMC Bioinformatics. 2009. PMID: 19236712 Free PMC article. - A general definition and nomenclature for alternative splicing events.
Sammeth M, Foissac S, Guigó R. Sammeth M, et al. PLoS Comput Biol. 2008 Aug 8;4(8):e1000147. doi: 10.1371/journal.pcbi.1000147. PLoS Comput Biol. 2008. PMID: 18688268 Free PMC article. - Comparative genomics approach to detecting split-coding regions in a low-coverage genome: lessons from the chimaera Callorhinchus milii (Holocephali, Chondrichthyes).
Dessimoz C, Zoller S, Manousaki T, Qiu H, Meyer A, Kuraku S. Dessimoz C, et al. Brief Bioinform. 2011 Sep;12(5):474-84. doi: 10.1093/bib/bbr038. Epub 2011 Jun 28. Brief Bioinform. 2011. PMID: 21712341 Free PMC article. - Widespread polymorphism in the positions of stop codons in Drosophila melanogaster.
Lee YC, Reinhardt JA. Lee YC, et al. Genome Biol Evol. 2012;4(4):533-49. doi: 10.1093/gbe/evr113. Epub 2011 Nov 8. Genome Biol Evol. 2012. PMID: 22051795 Free PMC article.
References
- Stoltzfus A. Molecular evolution: Introns fall into place. Curr Biol. 2004;14:R351–R352. - PubMed
- Qiu WG, Schisler N, Stoltzfus A. The evolutionary gain of spliceosomal introns: Sequence and phase preferences. Mol Biol Evol. 2004;21:1252–1263. - PubMed
Publication types
MeSH terms
LinkOut - more resources
Full Text Sources
Other Literature Sources
Molecular Biology Databases


