Specific remodeling of splenic architecture by cytomegalovirus - PubMed (original) (raw)
Specific remodeling of splenic architecture by cytomegalovirus
Chris A Benedict et al. PLoS Pathog. 2006 Mar.
Abstract
Efficient immune defenses are facilitated by the organized microarchitecture of lymphoid organs, and this organization is regulated by the compartmentalized expression of lymphoid tissue chemokines. Mouse cytomegalovirus (MCMV) infection induces significant remodeling of splenic microarchitecture, including loss of marginal zone macrophage populations and dissolution of T and B cell compartmentalization. MCMV preferentially infected the splenic stroma, targeting endothelial cells (EC) as revealed using MCMV-expressing green fluorescent protein. MCMV infection caused a specific, but transient transcriptional suppression of secondary lymphoid chemokine (CCL21). The loss of CCL21 was associated with the failure of T lymphocytes to locate within the T cell zone, although trafficking to the spleen was unaltered. Expression of CCL21 in lymphotoxin (LT)-alpha-deficient mice is dramatically reduced, however MCMV infection further reduced CCL21 levels, suggesting that viral modulation of CCL21 was independent of LTalpha signaling. Activation of LTbeta-receptor signaling with an agonistic antibody partially restored CCL21 mRNA expression and redirected transferred T cells to the splenic T cell zone in MCMV-infected mice. These results indicate that virus-induced alterations in lymphoid tissues can occur through an LT-independent modulation of chemokine transcription, and targeting of the LT cytokine system can counteract lymphoid tissue remodeling by MCMV.
Conflict of interest statement
Competing interests. The authors have declared that no competing interests exist.
Figures
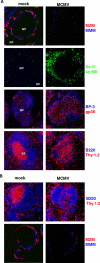
Figure 1. MCMV Modulates Splenic Architecture
(A) Spleens from PBS (mock) or MCMV-infected B6 mice (3.2 × 10⁵ pfu) were harvested at day 3 post-infection for immunohistochemical analysis. Spleen sections were incubated with markers specific to MMM (MOMA-1, MMM, blue), MZM (ER-TR9, MZM, red), granulocytes (Gr-1/Ly-6G, green), stromal cell populations (BP-3, blue, to identify B-cell-zone stromal cells and gp38, red, to identify T-cell-zone stromal cells, in uninfected mice), and B (B220, blue), and T lymphocytes (Thy1.2, red) (magnification 20×). These sections are representative of four independent experiments with n = 3 mice per group with two or more sections taken from each spleen. White pulp (WP) and red pulp (RP) and the location of the central arteriole (ca) are indicated. (B) Similar immunohistochemical analysis performed on Balb/c mice, 3 d post-MCMV-infection (1 × 10⁵ pfu).
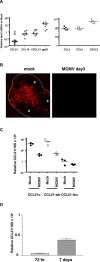
Figure 2. Reduced CCL21-ser Expression after MCMV Infection
Spleens from B6 mice mock-infected or infected with 3.2 × 10⁵ (A,B,D) or 1.5 × 10⁵ (C) pfu of MCMV were harvested at day 3 post-infection. Gene expression was measured by quantitative PCR and was normalized to 18S RNA and presented as relative mRNA levels compared to uninfected mice (A and D) or as absolute values (C). When presented as relative values, mRNA levels from three uninfected mice (mock) were determined and averaged for comparison for each experiment. Open symbols in (A) represent mice infected with UV-inactivated MCMV (equivalent to 3.2 × 10⁵ pfu). (B) Immunohistochemical analysis of CCL21 expression in the spleen of a mock or MCMV-infected B6 mouse 3 d post-infection; the location of the periarteriolar lymphoid sheath “PALS” and B-cell follicles “B” is noted, and the interrupted white line indicates the outer edge of the MZ. This section is representative of three experiments (n = 3 mice per group). In (C), primers used for analysis of CCL21 levels amplified either the serine (CCL21-ser), leucine (CCL21-leu), or both (CCL21u) isoforms. The data in (D) is an average of three infected mice ± SEM (p < .001).
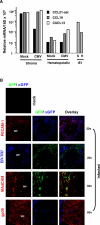
Figure 3. MCMV Splenic Tropism
All analysis was performed 3 d post virus infection. (A) Splenic stromal cells from mock or MCMV (2 × 10⁵ pfu, Smith strain) infected spleens were separated from hematopoietic cells by extrusion through a nylon mesh filter (see Materials and Methods). Total cell RNA was then isolated from either the stromal cells (S) or hematopoietic cells (H) fractions, and quantitative RT-PCR was performed to detect expression of CCL21-ser, CCL19, and CXCL13 as well as expression of the MCMV immediate early-1 (IE1) transcript. (B) Spleens from MCMV-GFP infected mice (2 × 10⁵ pfu) were examined by immunohistochemistry. Panels are color-coded with the text for the antigen examined, and field magnification is shown to the right of the panels. No background staining was seen in uninfected mouse spleen when directly detecting GFP expression or when using an anti-GFP antibody (αGFP) for signal amplification. WP, white pulp.
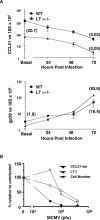
Figure 4. MCMV-Induced Suppression of CCL21 Is Independent of LTαβ-LTβR Signaling
LTα-deficient or wild-type (B6) mice were infected with MCMV (Smith strain, 3.2 × 10⁵ pfu), and spleens were harvested at various times post-infection for analysis of CCL21 and gp38 levels by quantitative PCR. Gene expression levels displayed on the _y_-axis are the levels in uninfected mice, and fold reduction in gene expression in uninfected LTα−/− compared with wild-type is shown in the parentheses near the _y_-axis. Values in parentheses at the right of the figure represent the fold reduction in gene expression 3 d post-virus-infection compared with uninfected mice of the same genotype. (B) B6 mice were infected with various amounts of MCMV (2 × 10⁴, 1 × 10⁵, 3.2 × 10⁵ pfu), and spleens were harvested 3 d post-infection for analysis of CCL21-ser and LTβ mRNA levels by quantitative PCR. Mice were infected in parallel with the same doses of MCMV for analysis of total splenocyte numbers 3 d post-infection.
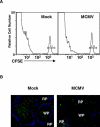
Figure 5. MCMV-Induced Suppression of CCL21 Abolishes T Cell Localization to the White Pulp
Mock- or MCMV-infected B6 mice (1.5 × 10⁵ pfu) were injected with CFSE labeled naive T cells, and spleens were removed for analysis 2 h later. (A) Flow cytometry was used to assess the total number of CFSE-labeled cells in the spleen after adoptive transfer into mice 3 d post-infection. (B) Immunohistochemical analysis of T cell localization in the spleen at 3 d post-infection using the MOMA-1 marker to identify MMM (shown in blue, magnification 10×). WP, white pulp; RP, red pulp.
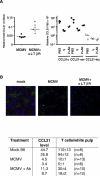
Figure 6. Pharmacologic Activation of LTβR Signaling Partially Restores CCL21 Expression and T Cell Localization in the Spleen of MCMV-Infected Mice
(A) Quantitative PCR was used to determine the relative levels of CCL21 gene expression 3 d post-MCMV infection in spleens from control- or virus- (V) infected mice ± agonistic anti-LTβR antibody (Ab) treatment. Left panel, 3.2 × 10⁵ pfu of MCMV was used for infection, and only total CCL21 mRNA levels were analyzed using CCL21u primers (see below). Right Panel, mice were infected with 1.5 × 10⁵ pfu MCMV and expression of the various CCL21 isoforms was determined. CCL21u, universal CCL21 primers that amplify both the leucine (leu) and serine (ser) isoforms; p = 0.02 (B) Shown are representative spleen sections from the same mice that were analyzed in the right panel of (A). Sections were incubated with an antibody to detect MMM (MOMA-1, MMM, blue), and adoptively transferred, CFSE-labeled T cells are green. The number of CFSE labeled T cells located per WP area after transfer was analyzed (n = number of WP regions analyzed per spleen), and differences between groups of infected mice ± antibody is statistically significant to a _p-_value < 0.0001.
Similar articles
- The complementation of lymphotoxin deficiency with LIGHT, a newly discovered TNF family member, for the restoration of secondary lymphoid structure and function.
Wang J, Foster A, Chin R, Yu P, Sun Y, Wang Y, Pfeffer K, Fu YX. Wang J, et al. Eur J Immunol. 2002 Jul;32(7):1969-79. doi: 10.1002/1521-4141(200207)32:7<1969::AID-IMMU1969>3.0.CO;2-M. Eur J Immunol. 2002. PMID: 12115617 - Differing activities of homeostatic chemokines CCL19, CCL21, and CXCL12 in lymphocyte and dendritic cell recruitment and lymphoid neogenesis.
Luther SA, Bidgol A, Hargreaves DC, Schmidt A, Xu Y, Paniyadi J, Matloubian M, Cyster JG. Luther SA, et al. J Immunol. 2002 Jul 1;169(1):424-33. doi: 10.4049/jimmunol.169.1.424. J Immunol. 2002. PMID: 12077273 - Dissecting the role of lymphotoxin in lymphoid organs by conditional targeting.
Tumanov AV, Grivennikov SI, Shakhov AN, Rybtsov SA, Koroleva EP, Takeda J, Nedospasov SA, Kuprash DV. Tumanov AV, et al. Immunol Rev. 2003 Oct;195:106-16. doi: 10.1034/j.1600-065x.2003.00071.x. Immunol Rev. 2003. PMID: 12969314 Review. - Sources and signals regulating type I interferon production: lessons learned from cytomegalovirus.
Verma S, Benedict CA. Verma S, et al. J Interferon Cytokine Res. 2011 Feb;31(2):211-8. doi: 10.1089/jir.2010.0118. Epub 2011 Jan 12. J Interferon Cytokine Res. 2011. PMID: 21226618 Free PMC article. Review.
Cited by
- Immune response and immunopathology during toxoplasmosis.
Dupont CD, Christian DA, Hunter CA. Dupont CD, et al. Semin Immunopathol. 2012 Nov;34(6):793-813. doi: 10.1007/s00281-012-0339-3. Epub 2012 Sep 7. Semin Immunopathol. 2012. PMID: 22955326 Free PMC article. Review. - Ly49h-deficient C57BL/6 mice: a new mouse cytomegalovirus-susceptible model remains resistant to unrelated pathogens controlled by the NK gene complex.
Fodil-Cornu N, Lee SH, Belanger S, Makrigiannis AP, Biron CA, Buller RM, Vidal SM. Fodil-Cornu N, et al. J Immunol. 2008 Nov 1;181(9):6394-405. doi: 10.4049/jimmunol.181.9.6394. J Immunol. 2008. PMID: 18941230 Free PMC article. - Cross-regulation between herpesviruses and the TNF superfamily members.
Sedý JR, Spear PG, Ware CF. Sedý JR, et al. Nat Rev Immunol. 2008 Nov;8(11):861-73. doi: 10.1038/nri2434. Nat Rev Immunol. 2008. PMID: 18949019 Free PMC article. Review. - Downregulation of key early events in the mobilization of antigen-bearing dendritic cells by leukocyte immunoglobulin-like Receptor B4 in a mouse model of allergic pulmonary inflammation.
Fanning LB, Buckley CC, Xing W, Breslow RG, Katz HR. Fanning LB, et al. PLoS One. 2013;8(2):e57007. doi: 10.1371/journal.pone.0057007. Epub 2013 Feb 19. PLoS One. 2013. PMID: 23431396 Free PMC article. - MCMV-mediated inhibition of the pro-apoptotic Bak protein is required for optimal in vivo replication.
Fleming P, Kvansakul M, Voigt V, Kile BT, Kluck RM, Huang DC, Degli-Esposti MA, Andoniou CE. Fleming P, et al. PLoS Pathog. 2013 Feb;9(2):e1003192. doi: 10.1371/journal.ppat.1003192. Epub 2013 Feb 28. PLoS Pathog. 2013. PMID: 23468630 Free PMC article.
References
- Kraal G. Cells in the marginal zone of the spleen. Int Rev Cytol. 1992;132:31–74. - PubMed
- Cyster JG. Chemokines, sphingosine-1-phosphate, and cell migration in secondary lymphoid organs. Annu Rev Immunol. 2005;23:127–159. - PubMed
- Forster R, Schubel A, Breitfeld D, Kremmer E, Renner-Muller I, et al. CCR7 coordinates the primary immune response by establishing functional microenvironments in secondary lymphoid organs. Cell. 1999;99:23–33. - PubMed
Publication types
MeSH terms
Substances
Grants and funding
- R37AI03368/AI/NIAID NIH HHS/United States
- CA69381/CA/NCI NIH HHS/United States
- R01 AI048073/AI/NIAID NIH HHS/United States
- R21 AI061549/AI/NIAID NIH HHS/United States
- AI061549/AI/NIAID NIH HHS/United States
- AI48073/AI/NIAID NIH HHS/United States
- P01 CA069381/CA/NCI NIH HHS/United States
LinkOut - more resources
Full Text Sources
Other Literature Sources
Medical
