Changes in chromatin structure and mobility in living cells at sites of DNA double-strand breaks - PubMed (original) (raw)
Changes in chromatin structure and mobility in living cells at sites of DNA double-strand breaks
Michael J Kruhlak et al. J Cell Biol. 2006.
Abstract
The repair of DNA double-strand breaks (DSBs) is facilitated by the phosphorylation of H2AX, which organizes DNA damage signaling and chromatin remodeling complexes in the vicinity of the lesion. The disruption of DNA integrity induces an alteration of chromatin architecture that has been proposed to activate the DNA damage transducing kinase ataxia telangiectasia mutated. However, little is known about the physical properties of damaged chromatin. In this study, we use a photoactivatable version of GFP-tagged histone H2B to examine the mobility and structure of chromatin containing DSBs in living cells. We find that chromatin containing DSBs exhibits limited mobility but undergoes an energy-dependent local expansion immediately after DNA damage. The localized expansion observed in real time corresponds to a 30-40% reduction in the density of chromatin fibers in the vicinity of DSBs, as measured by energy-filtering transmission electron microscopy. The observed opening of chromatin occurs independently of H2AX and ATM. We propose that localized adenosine triphosphate-dependent decondensation of chromatin at DSBs establishes an accessible subnuclear environment that facilitates DNA damage signaling and repair.
Figures
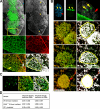
Figure 1.
The distribution and mobility of DSBs in living WT and H2AX−/− MEFs. (A) WT and H2AX−/− MEFs expressing H2B-PAGFP were photoactivated with UV laser microirradiation in specific regions (circles and lines) within the nucleus (first row). DNA DSBs were introduced when cells were incubated with Hoechst 33342 DNA-binding dye (fourth row), as shown by γ-H2AX staining in WT cells (second row) and Nbs1 staining in WT and H2AX−/− cells (third row). Bar, 30 μm. (B) WT MEFs expressing H2B-PAGFP were UV laser irradiated to photoactivate PAGFP and introduce DNA DSBs in subnuclear regions that were monitored over a 60-min time period. In the pre-UV panel, the green outline denotes the boundary of the nucleus, and the red circles denote UV laser–irradiated regions. Bar, 15 μm. (C) Mean squared displacement of the center of mass intensities of circular photoactivated and DSB-containing or solely photoactivated regions from their original position immediately after exposure to UV laser microirradiation until 10 min after irradiation. Image series were corrected for background and overall cellular migration by image registration before the calculation of center of mass intensities. Displacement values were calculated for WT with DSBs (triangles), WT without DSBs (circles), H2AX−/− with DSBs (Xs), and H2AX−/− without DSBs (squares). At least 40 cells were examined for each genotype and treatment. No significant difference was found between the mean squared displacement of regions containing or lacking DSBs (P > 0.25). Error bars represent SD. (D) WT MEFs expressing GFP-53BP1 were irradiated with 10 Gy γ irradiation and immediately placed on a heating stage of the LSM microscope. Foci, which appeared within 5 min, were tracked for 50 min. The yellow box denotes the region zoomed in the top right corner inset. The insets show multiple IRIF within close proximity to each other that frequently interact but then subsequently separate (yellow arrow). Bar, 5 μm.
Figure 2.
Local expansion in chromatin structure upon the introduction of DSBs. (A) Specific subnuclear regions were photoactivated, and DSBs were introduced in H2AX−/− cells by UV laser microirradiation. A nucleus with four circular and one rectangular region is shown with the arrow in the post-UV image, denoting the zoomed circular region presented in the top right and bottom left corner insets. Binary maps for each time point were generated, and the map for the post-UV image (set as white) was superimposed onto the maps (set as green) for each subsequent time point (bottom left inset). The pre-UV image shows the outline of the nucleus in green and the prephotoactivated and DSB-containing regions in red. Bar, 15 μm. (B) H2AX−/− MEFs expressing H3-GFP were incubated with Hoechst dye, and a subregion of the GFP signal was photobleached using the 488-nm laser (red square, left). Subsequently, two flanking regions were exposed to UV laser microirradiation (two white squares, left), and the cell was followed for 180 s after UV laser microirradiation (right). Binary maps for the GFP signal above background were generated and colored white for the pre-488/pre-UV and post-488/pre-UV images (shown in the second row and at higher magnification in the bottom row). Binary maps for the post-UV and 180 s post-UV images were colored green and super imposed onto the white binary map from the post-488/pre-UV image. The difference in area between the post-UV and 180 s post-UV images is shown in green relative to the white images in the bottom two rows. The chromatin regions containing DSBs expand into the nondamaged region, whereas the nondamaged regions above the photobleached GFP square do not display any expansion. Bar, 5 μm. (C) A nucleus containing two copies of the MMTV gene array and expressing GFP-GR localized to the nucleus was exposed to UV laser microirradiation in only one of the two gene arrays, shown as a red circle in the left image and in the top corner inset. The nondamaged gene array is denoted by the white arrow and in the bottom corner inset. Bar, 15 μm. (D) MMTV gene array–containing cells similar to those described in Fig. 2 C, but 90 s after exposure to UV laser microirradiation, they were fixed and DNA FISH was performed probing for the gene array, as shown in the right panel. The two cells shown have a single copy of the gene array. Red circles in the left image denote gene arrays exposed to UV laser microirradiation. Bar, 15 μm. (E) Area of nondamaged MMTV arrays and DNA FISH. Cells containing the MMTV gene array and expressing GFP-GR localized to the nucleus were sensitized by the Hoechst dye but not exposed to UV laser microirradiation. DNA FISH was performed using MMTV gene array–specific probes, and fluorescence images were collected. Bar, 10 μm. (F) Measurements of the expansion in area for photoactivated H2B-PAGFP subnuclear regions in damaged and nondamaged WT (with or without ATP depletion), H2AX−/−, and ATM−/− live cells. Measured starting area of circular regions was ∼7.08 μm2 for all samples. (G) Area occupied by MMTV gene arrays in living cells and after DNA FISH in both damaged and nondamaged gene arrays.
Figure 3.
Ultrastructure of chromatin containing DSBs. (A) WT cells exposed to UV laser microirradiation and containing DSBs were labeled against γ-H2AX to mark DSBs, which is shown by green fluorescence track overlaid onto the low magnification ESI net phosphorus image in the top left panel. The ESI image is also in the top right panel with three asterisks denoting the right-most boundary of the track exposed to UV laser microirradiation (two gray lines traversing the laser track are EM sectioning artifacts). The yellow box denotes the region imaged at higher magnification by ESI in the bottom four panels. The middle row in green is the high magnification net nitrogen image map and in red is the net phosphorus image map. The bottom left panel is a net phosphorous/nitrogen overlay image, with the yellow arrow denoting the region containing DSBs and the white arrow denoting part of the heterochromatin region just adjacent to the laser-irradiated region. The bottom right panel is the same net phosphorous/nitrogen overlay image but with a threshold mask applied to highlight, on a pixel by pixel basis, the areas of the image containing a phosphorous/nitrogen ratio representative of chromatin, which is shown in white. The yellow outline denotes the region containing DSBs that was used to calculate the chromatin density coefficients. Bar, 500 nm. (B) Ultrastructure of chromatin containing DSBs in UV laser–irradiated H2AX−/− cells. (top) Fluorescence images of Hoechst-stained DNA and Nbs1 (left and middle panels, respectively) in fixed cells after UV laser microirradiation. The Nbs1 staining in green highlights the subnuclear region exposed to UV microirradiation. The right panel in the top row is a resampled fluorescence image of the same nucleus but from the ultrathin section of the embedded cells, which is overlaid onto a low magnification net phosphorous image montage of the same nucleus imaged by ESI. The yellow arrows denote two heterochromatic regions exposed to UV laser microirradiation, and the red arrow points to an equivalent region not exposed to UV laser irradiation. The following three rows show the higher magnification ESI net phosphorous/nitrogen overlay (left column) and phosphorous/nitrogen ratio threshold mask plus overlay (right column) images as described in Fig. 3 A. The bottom row displays the region not exposed to UV laser microirradiation, whereas the middle two rows display the two regions exposed to UV laser irradiation. DSBs reduce the density of chromatin fibers (white) within heterochromatin by ∼40%. The yellow outlines denote the regions used to calculate the chromatin density coefficients. Bar, 500 nm. (C) ESI images of IRIF in WT cells. The left panel shows a resampled fluorescence image map of the sectioned nucleus, subsequently imaged by ESI at high magnification. The white arrow denotes the single focus presented in the high magnification ESI net phosphorous/nitrogen overlay image (middle) and phosphorous/nitrogen ratio threshold mask plus overlay image (right) as described in Fig. 3 A. The cluster of silver-enhanced immunogold particles is shown in white in the net phosphorous/nitrogen overlay image (middle). The yellow outline denotes the IRIF area containing gold particles, which was used to calculate the IRIF chromatin density coefficient. Bar, 380 nm. (D) Quantitation of phosphorous/nitrogen chromatin density coefficients in UV and γ-irradiated samples compared with regions not exposed to irradiation (at least 10 cells were analyzed for each genotype and treatment).
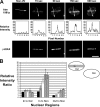
Figure 4.
ATM kinase at chromatin containing DSBs. (A) HeLa cells expressing H2B-PAGFP were fixed either 15, 60, 150, or 600 s after exposure to UV laser microirradiation and stained for both ATM phospho-Ser 1981 (ATM-1981p, top) and γ-H2AX (bottom). A control, non–UV laser–irradiated nucleus is shown in the first column. Line profiles of background-corrected mean pixel intensities were plotted for ATM-1981p staining in each nucleus (middle). The arrows (top) indicate the direction of the individual line scans. Bar, 15 μm. (B) Intensity of ATM-1981p in different subregions of UV laser–irradiated HeLa cells relative to cells not exposed to the UV laser at different time points after UV as displayed in A. Background-corrected mean pixel intensity of areas within the UV laser–irradiated region (in), outside the laser-exposed region of the same cell (out), and in a nucleus not exposed to the UV laser (non) were used to calculate the ratios shown (in/out, in/non, and out/non, respectively). Ratios were calculated for 15 s (black), 60 s (gray), 2.5 min (white), 10 min (forward slash), and 15 min (back slash) after exposure to UV laser irradiation. Error bars represent SD.
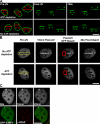
Figure 5.
Chromatin remodeling and DNA damage repair factor recruitment are ATP dependent. (A) DSBs were introduced in WT HeLa cells expressing H2B-PAGFP in the presence (top) or absence (bottom) of ATP-depleting conditions of 10 mM 2-deoxyglucose and 10 mM Na-azide. Pre-UV, post-UV, and 180 s post-UV time series images are shown. Bar, 15 μm. (B) DSBs were introduced in WT MEFs expressing Nbs1-GFP (incubated with Hoechst dye) either in the presence (bottom) or absence (top) of ATP-depleting conditions (regions denoted by yellow rectangles), followed for 10 min by photobleaching of the Nbs1-GFP signal in regions covering both DNA-damaged and nondamaged chromatin (denoted by red squares) and the recovery of the Nbs1-GFP signal monitored over time (right). NBS1-GFP is not recruited to the UV laser–exposed region in the ATP-depleted cells; however, the protein exhibits rapid mobility in both the damaged and nondamaged regions in normal and ATP-depleted cells. Bar, 8 μm. (C) WT MEFs expressing GFP-53BP1 were incubated in ATP-depleting conditions, exposed to 2 Gy γ irradiation, and monitored for 20 min after irradiation before being fixed and immunolabeled against γ-H2AX. GFP-53BP1 failed to be recruited to IRIF even though a weak γ-H2AX–containing IRIF response exists. Bar, 8 μm.
Similar articles
- An insight into understanding the coupling between homologous recombination mediated DNA repair and chromatin remodeling mechanisms in plant genome: an update.
Banerjee S, Roy S. Banerjee S, et al. Cell Cycle. 2021 Sep;20(18):1760-1784. doi: 10.1080/15384101.2021.1966584. Epub 2021 Aug 26. Cell Cycle. 2021. PMID: 34437813 Free PMC article. Review. - ATM alters the otherwise robust chromatin mobility at sites of DNA double-strand breaks (DSBs) in human cells.
Becker A, Durante M, Taucher-Scholz G, Jakob B. Becker A, et al. PLoS One. 2014 Mar 20;9(3):e92640. doi: 10.1371/journal.pone.0092640. eCollection 2014. PLoS One. 2014. PMID: 24651490 Free PMC article. - Histone H2AX phosphorylation is dispensable for the initial recognition of DNA breaks.
Celeste A, Fernandez-Capetillo O, Kruhlak MJ, Pilch DR, Staudt DW, Lee A, Bonner RF, Bonner WM, Nussenzweig A. Celeste A, et al. Nat Cell Biol. 2003 Jul;5(7):675-9. doi: 10.1038/ncb1004. Nat Cell Biol. 2003. PMID: 12792649 - Species conserved DNA damage response at the inactive human X chromosome.
Müller I, Merk B, Voss KO, Averbeck N, Jakob B, Durante M, Taucher-Scholz G. Müller I, et al. Mutat Res. 2013 Aug 30;756(1-2):30-6. doi: 10.1016/j.mrgentox.2013.04.006. Epub 2013 Apr 28. Mutat Res. 2013. PMID: 23628434 - Chromatin perturbations during the DNA damage response in higher eukaryotes.
Bakkenist CJ, Kastan MB. Bakkenist CJ, et al. DNA Repair (Amst). 2015 Dec;36:8-12. doi: 10.1016/j.dnarep.2015.09.002. Epub 2015 Sep 9. DNA Repair (Amst). 2015. PMID: 26391293 Free PMC article. Review.
Cited by
- Real-Time Tracking of Parental Histones Reveals Their Contribution to Chromatin Integrity Following DNA Damage.
Adam S, Dabin J, Chevallier O, Leroy O, Baldeyron C, Corpet A, Lomonte P, Renaud O, Almouzni G, Polo SE. Adam S, et al. Mol Cell. 2016 Oct 6;64(1):65-78. doi: 10.1016/j.molcel.2016.08.019. Epub 2016 Sep 15. Mol Cell. 2016. PMID: 27642047 Free PMC article. - Complex Chromatin Motions for DNA Repair.
Miné-Hattab J, Chiolo I. Miné-Hattab J, et al. Front Genet. 2020 Aug 27;11:800. doi: 10.3389/fgene.2020.00800. eCollection 2020. Front Genet. 2020. PMID: 33061931 Free PMC article. Review. - DNA in motion during double-strand break repair.
Miné-Hattab J, Rothstein R. Miné-Hattab J, et al. Trends Cell Biol. 2013 Nov;23(11):529-36. doi: 10.1016/j.tcb.2013.05.006. Epub 2013 Jul 15. Trends Cell Biol. 2013. PMID: 23867212 Free PMC article. Review. - Functional implications of genome topology.
Cavalli G, Misteli T. Cavalli G, et al. Nat Struct Mol Biol. 2013 Mar;20(3):290-9. doi: 10.1038/nsmb.2474. Nat Struct Mol Biol. 2013. PMID: 23463314 Free PMC article. Review. - DNA damage response: three levels of DNA repair regulation.
Sirbu BM, Cortez D. Sirbu BM, et al. Cold Spring Harb Perspect Biol. 2013 Aug 1;5(8):a012724. doi: 10.1101/cshperspect.a012724. Cold Spring Harb Perspect Biol. 2013. PMID: 23813586 Free PMC article. Review.
References
- Aten, J.A., J. Stap, P.M. Krawczyk, C.H. van Oven, R.A. Hoebe, J. Essers, and R. Kanaar. 2004. Dynamics of DNA double-strand breaks revealed by clustering of damaged chromosome domains. Science. 303:92–95. - PubMed
- Bakkenist, C.J., and M.B. Kastan. 2003. DNA damage activates ATM through intermolecular autophosphorylation and dimer dissociation. Nature. 421:499–506. - PubMed
- Bakkenist, C.J., and M.B. Kastan. 2004. Initiating cellular stress responses. Cell. 118:9–17. - PubMed
Publication types
MeSH terms
Substances
LinkOut - more resources
Full Text Sources
Other Literature Sources
Research Materials
Miscellaneous


