Arl2 and Arl3 regulate different microtubule-dependent processes - PubMed (original) (raw)
Arl2 and Arl3 regulate different microtubule-dependent processes
Chengjing Zhou et al. Mol Biol Cell. 2006 May.
Abstract
Arl2 and Arl3 are closely related members of the Arf family of regulatory GTPases that arose from a common ancestor early in eukaryotic evolution yet retain extensive structural, biochemical, and functional features. The presence of Arl3 in centrosomes, mitotic spindles, midzones, midbodies, and cilia are all supportive of roles in microtubule-dependent processes. Knockdown of Arl3 by siRNA resulted in changes in cell morphology, increased acetylation of alpha-tubulin, failure of cytokinesis, and increased number of binucleated cells. We conclude that Arl3 binds microtubules in a regulated manner to alter specific aspects of cytokinesis. In contrast, an excess of Arl2 activity, achieved by expression of the [Q70L]Arl2 mutant, caused the loss of microtubules and cell cycle arrest in M phase. Initial characterization of the underlying defects suggests a defect in the ability to polymerize tubulin in the presence of excess Arl2 activity. We also show that Arl2 is present in centrosomes and propose that its action in regulating tubulin polymerization is mediated at centrosomes. Somewhat paradoxically, no phenotypes were observed Arl2 expression was knocked down or Arl3 activity was increased in HeLa cells. We conclude that Arl2 and Arl3 have related but distinct roles at centrosomes and in regulating microtubule-dependent processes.
Figures
Figure 1.
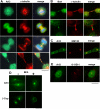
Arl2, Arl3, and Bart are centrosomal proteins. (A) CHO cells were labeled with antibodies specific to Arl2 or γ-tubulin after methanol fixation, as described in Material and Methods. Cells in different phases of the cell cycle are shown. Centrosomal staining of Arl3 is visualized in the merged images. Noncentrosomal Arl3 staining is also evident, in the form of puncta that can be as large as the centrosome (visualized by γ-tubulin staining). Insets are magnified views of the centrosomal staining. (B) The presence of Arl2 at centrosomes, visualized by costaining with antibodies to centrin, does not depend on microtubules as staining is unchanged after treatment of cells with nocodazole (15 μg/ml for 2 h). (C) Arl3 staining at centrosomes is shown, after staining methanol fixed NIH3T3 cells, as described in Material and Methods. Staining of Arl3 at centrosomes is shown in the absence (top panels) and presence (bottom panels) of nocodazole treatment, as described in B. (D) CHO cells were prepared as described in A and labeled with Bart and γ-tubulin antibodies.Bar under each panel, 10 μm.
Figure 2.
Arl2, Arl3, and Bart copurify with γ-tubulin in centrosomes from HeLa cells. Centrosomes were enriched from HeLa cells (∼3 × 10⁷ cells) using a modification of the method of Hsu and White (1998), as described in Material and Methods. Equal volumes of fractions from the sucrose velocity sedimentation gradient were immunoblotted with antisera to γ-tubulin, to locate centrosomes, and Arl2, Arl3, or Bart. Leftmost lane shows the whole cell lysate (WCL; 5 μg protein).
Figure 3.
Arl3 is found on microtubule-dense structures and Golgi membranes. (A) HeLa cells at different points of the cell cycle were fixed using PHEMO conditions and stained with Arl3 and α-tubulin antibodies. The presence of Arl3 on the mitotic spindle (top panels), the midzone (second panels), and in midbodies (two bottom panels) is clear from the extensive overlap with α-tubulin staining. Nuclear staining of Arl3 is also evident in the bottom panels. (B) Staining of Bart at midbodies is shown in methanol-fixed HeLa cells (top panels) and COS-7 cells (bottom panels), and compared with that of α-tubulin (middle panels). Note that Bart is in the midbody matrix in HeLa cells but radiating down the midbody in COS-7 cells. (C) The colocalization of Arl3 and GM130 at Golgi membranes is shown in Sf295 cells after double labeling of PFA-fixed cells. (D) The binding of Arl3 to Golgi membranes is insensitive to the addition of brefeldin A. Cells were treated with (+) or without (-) brefeldin A (BFA; 5 μg/ml) for 5 min before fixation with PFA and stained for Arl3 or β-COP, a subunit of the brefeldin A-sensitive COPI coatomer complex. β-COP has dissociated from the _cis_-Golgi under these conditions but Arl3 remains at the Golgi. (E) Arl3 is present in the primary cilium of NIH3T3 cells, after fixing with 4% PFA. Primary antibodies were the Arl3 polyclonal and acetylated α-tubulin mouse monoclonal (6-11 B-1). Bars, 10 μm.
Figure 4.
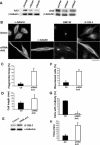
Phenotypes associated with the depletion of cellular Arl3. Two sequence-independent siRNA constructs were found to effectively deplete HeLa cells of Arl3 or Arl2 and resulting phenotypes are shown in cells 3 d after transfection. In all bar graphs control (empty vector) cells are shown with filled bars and Arl3 siRNA transfected cells are shown with the open bars. (A) Knockdowns in the levels of total cell Arl3 (left) or Arl2 (right) after transfection of HeLa cells with two sequence-independent siRNA constructs in the pSUPER vector, as described under Material and Methods. Immunoblots are shown of total cell lysates (15 μg/lane) in control (lane 1), and each of the two siRNA-transfected cells (siRNA 1 and 2) for each target. β-tubulin was included as a loading control. Under these conditions, we routinely obtain 50-70% transfection efficiencies. (B) HeLa cells were transfected with empty vector (top panels) or Arl3 siRNA 1 (bottom panels) and were fixed with PHEMO and stained with α-tubulin, GM130, or acetylated α-tubulin (6-11 B-1) antibodies. Representative cells displaying increases in cell length, binucleated cells, vesiculated Golgi, and increased acetylated tubulin staining are shown. Bar, 30 μm. (C) Golgi fragmentation was monitored by staining PHEMO-fixed cells with GM130, as a marker of the Golgi. Results shown are the average of four independent experiments with a total of >175 cells counted in each case. Error bars, 1 SD between experiments. (D) The average length of cells was determined by measuring the long axis of random cells in the population, 3 d after transfections. Controls were transfected with pSUPER carrying no insert. The results from two different experiments are shown, with 93 and 61 cells counted in total from control and Arl3 siRNA cells, respectively. (E) The apparent increase in acetylated tubulin staining in cells depleted for Arl3 was confirmed by immunoblotting with acetylated tubulin (6-11 B-1, top lanes) and α-tubulin (bottom lanes) antibodies of 20 μg total cell protein in control (left) versus Arl3 siRNA cells (right). (F) The percentage of cells that were binucleated was determined by counting bisbenzamide stained cells. Results shown are averages from three independent experiments with a total of 210 and 240 cells counted for control and Arl3 siRNA, respectively. (G) The percentages of cells with a midbody, visualized by staining PHEMO-fixed cells with α-tubulin antibody, were determined. The percentages of cells with midbodies are shown from three independent experiments, with a total n > 200 cells for each condition. Error bars, 1 SD between experiments. (H) The length of time of prometaphase/metaphase was determined in control (n = 13) or Arl3 siRNA (n = 10) cells as the time between chromosome condensation and chromosome segregation by counting frames in time-lapse movies of HeLa cells that coexpressed cherry-α-tubulin and histone-GFP, as described in Material and Methods and shown in Figure 5. Each of these phenotypes described for Arl3 siRNA was observed with each siRNA constructs but quantitation was only performed with one.
Figure 5.
Depletion of Arl3 results in early or late failure in cytokinesis. HeLa cells were triply cotransfected with empty vector (control; top panels) or plasmids directing knockdown of Arl3 (middle and bottom panels) and expression of cherry-α-tubulin and GFP-histone and time-lapse images were collected as described in Material and Methods. Frames were captured at the indicated time after metaphase began (hours:minutes). The middle panels show a cell with a late failure in cytokinesis as a midbody bridge can be clearly seen at 2:15 but the cells later fused and formed a single, binucleated cell by 3:35. The bottom lowest panels show a cell that underwent an early failure in cytokinesis. Bars in the leftmost panels, 5 μm.
Figure 6.
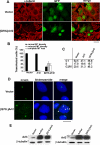
Expression of [Q70L]Arl2 causes the loss of microtubules and an M phase arrest. CHO cells were cotransfected with empty vector (control) or the pcDNA3-based plasmid directing expression of [Q70L]Arl2 and a second plasmid expressing EGFP to mark transfected cells. The effects on microtubules, cell cycle, and centrosomes were determined 18 h after transfection, as described in Material and Methods. (A) Control (top panels) or [Q70L]Arl2 expressing cells (bottom panels) were fixed with PHEMO and stained with antibodies to α-tubulin, to visualize microtubules. GFP-expressing cells are shown in the second panels. Note that transfected cells expressing [Q70L]Arl2 are markedly decreased in their content of microtubules. (B) The changes in microtubule content of transfected cells was quantified by visual inspection and assessed as “normal” microtubule staining, “reduced staining,” or “complete loss” of staining. Effects in control (empty vector) cells or those expressing wild-type Arl2 or [Q70L]Arl2, are shown. Data were averaged from three independent experiments, each consisting of counting 100 cells per condition. Error bars, 1 SD between experiments. (C) Cell cycle analyses were performed by flow cytometry on CHO cells 24 h after transfection with empty vector (pcDNA3.1), or vectors directing expression of wild-type Arl2 or [Q70L]Arl2. The percentages of cells in the population at different parts of the cell cycle are shown. This experiment was repeated twice, with similar results. (D) Fragmentation of centrosomes was observed after expression of [Q70L]Arl2. Control or [Q70L]Arl2-expressing CHO cells were fixed with methanol and stained for ninein and bisbenzamide. The fragmented centrosome in one cell is marked with arrowheads. Bars, 30 μm. (E) CHO cells were transfected with empty vector or plasmids directing expression of wild type or [Q70L]Arl2 (left panel or wild type or [Q71L]Arl3 (right panel) and 18 h later cells were collected and analyzed for Arl content by immunoblot. The endogenous proteins can be seen in each case in the control lanes and the exogenously expressed proteins are overexposed to allow visualization and comparison to the endogenous proteins. Note that the Arls are increased several fold relative to the endogenous proteins and that the overexpression of the wild-type proteins was at least as high as those of the dominant activating mutants.
Figure 7.
High concentrations of taxol prevent the loss of microtubules seen upon expression of [Q70L]Arl2. CHO cells were cotransfected with plasmids directing expression of [Q70L]Arl2 and EGFP, and 5 h later were treated with different concentrations of taxol (3 nM-1 μM). Cells were fixed with PHEMO and processed for α-tubulin staining 24 h after transfection. The persistence of microtubule staining was evident at the higher concentrations (>30 μM) of taxol when cells were stained for α-tubulin and the results were quantified. The results of three independent experiments were averaged; each experiment consisted of counting 80-100 cells. Error bars, 1 SD between experiments.
Figure 8.
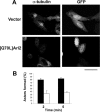
Expression of [Q70L]Arl2 prevents microtubule regrowth. Control and [Q70L]Arl2-expressing CHO cells were treated with nocodazole (15 μg/ml) for 2 h. After the drug was removed, cells were incubated for varying times before fixation in PHEMO and stained for α-tubulin to visualize nascent microtubule asters and EGFP fluorescence was used to identify transfected cells. (A) Regrowth of microtubule can be visualized as asters in these images, taken 5 min after removal of the drug, in control cells (top panel) and in untransfected cells (bottom panel). Cells expressing [Q70L]Arl2, identified by coexpression with GFP, were devoid of asters (bottom panels). (B) This effect was quantified by counting asters in control (▪) and [Q70L]Arl2-expressing (□) cells at 2 (left set of bars) or 5 min (right) after removal of nocodazole. Bar, 20 μm.
Similar articles
- Higher order signaling: ARL2 as regulator of both mitochondrial fusion and microtubule dynamics allows integration of 2 essential cell functions.
Francis JW, Turn RE, Newman LE, Schiavon C, Kahn RA. Francis JW, et al. Small GTPases. 2016 Oct;7(4):188-196. doi: 10.1080/21541248.2016.1211069. Epub 2016 Jul 11. Small GTPases. 2016. PMID: 27400436 Free PMC article. Review. - Roles for ELMOD2 and Rootletin in ciliogenesis.
Turn RE, Linnert J, Gigante ED, Wolfrum U, Caspary T, Kahn RA. Turn RE, et al. Mol Biol Cell. 2021 Apr 15;32(8):800-822. doi: 10.1091/mbc.E20-10-0635. Epub 2021 Feb 17. Mol Biol Cell. 2021. PMID: 33596093 Free PMC article. - Arl2- and Msps-dependent microtubule growth governs asymmetric division.
Chen K, Koe CT, Xing ZB, Tian X, Rossi F, Wang C, Tang Q, Zong W, Hong WJ, Taneja R, Yu F, Gonzalez C, Wu C, Endow S, Wang H. Chen K, et al. J Cell Biol. 2016 Mar 14;212(6):661-76. doi: 10.1083/jcb.201503047. Epub 2016 Mar 7. J Cell Biol. 2016. PMID: 26953351 Free PMC article. - The ARL2 GTPase is required for mitochondrial morphology, motility, and maintenance of ATP levels.
Newman LE, Zhou CJ, Mudigonda S, Mattheyses AL, Paradies E, Marobbio CM, Kahn RA. Newman LE, et al. PLoS One. 2014 Jun 9;9(6):e99270. doi: 10.1371/journal.pone.0099270. eCollection 2014. PLoS One. 2014. PMID: 24911211 Free PMC article. - Sorting of lipidated cargo by the Arl2/Arl3 system.
Fansa EK, Wittinghofer A. Fansa EK, et al. Small GTPases. 2016 Oct;7(4):222-230. doi: 10.1080/21541248.2016.1224454. Epub 2016 Nov 2. Small GTPases. 2016. PMID: 27806215 Free PMC article. Review.
Cited by
- The ARF GAP ELMOD2 acts with different GTPases to regulate centrosomal microtubule nucleation and cytokinesis.
Turn RE, East MP, Prekeris R, Kahn RA. Turn RE, et al. Mol Biol Cell. 2020 Aug 15;31(18):2070-2091. doi: 10.1091/mbc.E20-01-0012. Epub 2020 Jul 2. Mol Biol Cell. 2020. PMID: 32614697 Free PMC article. - Characterization of the small Arabidopsis thaliana GTPase and ADP-ribosylation factor-like 2 protein TITAN 5.
Mohr I, Mirzaiebadizi A, Sanyal SK, Chuenban P, Ahmadian MR, Ivanov R, Bauer P. Mohr I, et al. J Cell Sci. 2024 Aug 1;137(15):jcs262315. doi: 10.1242/jcs.262315. Epub 2024 Aug 14. J Cell Sci. 2024. PMID: 39056156 Free PMC article. - A New STAT3-binding Partner, ARL3, Enhances the Phosphorylation and Nuclear Accumulation of STAT3.
Togi S, Muromoto R, Hirashima K, Kitai Y, Okayama T, Ikeda O, Matsumoto N, Kon S, Sekine Y, Oritani K, Matsuda T. Togi S, et al. J Biol Chem. 2016 May 20;291(21):11161-71. doi: 10.1074/jbc.M116.724849. Epub 2016 Apr 5. J Biol Chem. 2016. PMID: 27048653 Free PMC article. - Arl2 GTPase associates with the centrosomal protein Cdk5rap2 to regulate cortical development via microtubule organization.
Ma D, Lin KY, Suresh D, Lin J, Gujar MR, Aung HY, Tan YS, Gao Y, Vincent AS, Chen T, Wang H. Ma D, et al. PLoS Biol. 2024 Aug 13;22(8):e3002751. doi: 10.1371/journal.pbio.3002751. eCollection 2024 Aug. PLoS Biol. 2024. PMID: 39137170 Free PMC article. - Tubulin binding cofactor C (TBCC) suppresses tumor growth and enhances chemosensitivity in human breast cancer cells.
Hage-Sleiman R, Herveau S, Matera EL, Laurier JF, Dumontet C. Hage-Sleiman R, et al. BMC Cancer. 2010 Apr 12;10:135. doi: 10.1186/1471-2407-10-135. BMC Cancer. 2010. PMID: 20384997 Free PMC article.
References
- Albertson, R., Riggs, B., and Sullivan, W. (2005). Membrane traffic: a driving force in cytokinesis. Trends Cell Biol. 15, 92-101. - PubMed
- Antoshechkin, I., and Han, M. (2002). The C. elegans evl-20 gene is a homolog of the small GTPase ARL2 and regulates cytoskeleton dynamics during cytokinesis and morphogenesis. Dev. Cell 2, 579-591. - PubMed
- Avidor-Reiss, T., Maer, A. M., Koundakjian, E., Polyanovsky, A., Keil, T., Subramaniam, S., and Zuker, C. S. (2004). Decoding cilia function: defining specialized genes required for compartmentalized cilia biogenesis. Cell 117, 527-539. - PubMed
- Bartolini, F., Bhamidipati, A., Thomas, S., Schwahn, U., Lewis, S. A., and Cowan, N. J. (2002). Functional overlap between retinitis pigmentosa 2 protein and the tubulin-specific chaperone cofactor C. J. Biol. Chem. 277, 14629-14634. - PubMed
Publication types
MeSH terms
Substances
LinkOut - more resources
Full Text Sources
Other Literature Sources
Molecular Biology Databases


