NABP1, a novel RORgamma-regulated gene encoding a single-stranded nucleic-acid-binding protein - PubMed (original) (raw)
NABP1, a novel RORgamma-regulated gene encoding a single-stranded nucleic-acid-binding protein
Hong Soon Kang et al. Biochem J. 2006.
Abstract
RORgamma2 (retinoid-related orphan receptor gamma2) plays a critical role in the regulation of thymopoiesis. Microarray analysis was performed in order to uncover differences in gene expression between thymocytes of wild-type and RORgamma-/- mice. This analysis identified a novel gene encoding a 22 kDa protein, referred to as NABP1 (nucleic-acid-binding protein 1). This subsequently led to the identification of an additional protein, closely related to NABP1, designated NABP2. Both proteins contain an OB (oligonucleotide/oligosaccharide binding) motif at their N-terminus. This motif is highly conserved between the two proteins. NABP1 is highly expressed in the thymus of wild-type mice and is greatly suppressed in RORgamma-/- mice. During thymopoiesis, NABP1 mRNA expression is restricted to CD4+CD8+ thymocytes, an expression pattern similar to that observed for RORgamma2. These observations appear to suggest that NABP1 expression is regulated either directly or indirectly by RORgamma2. Confocal microscopic analysis showed that the NABP1 protein localizes to the nucleus. Analysis of nuclear proteins by size-exclusion chromatography indicated that NABP1 is part of a high molecular-mass protein complex. Since the OB-fold is frequently involved in the recognition of nucleic acids, the interaction of NABP1 with various nucleic acids was examined. Our results demonstrate that NABP1 binds single-stranded nucleic acids, but not double-stranded DNA, suggesting that it functions as a single-stranded nucleic acid binding protein.
Figures
Figure 1. Nucleotide and amino acid sequences of mouse NABP1
(A) The nucleotide and putative amino acid sequences of mouse NABP1. The start and stop codons are in bold type. Underlined nucleotide sequences indicate the location of the forward and reverse primers (thin lines), and the probe (thick lines) used in real-time reverse transcriptase-PCR analysis. (B) Schematic view of the genomic structure of the mouse NABP1 gene. The genomic structure was deduced from the alignment of the cDNA sequences AY880264 and AK028886 with the mouse genomic DNA sequence (GenBank® AC125518.3) containing the NABP1 gene. Black boxes indicate exons. The NABP1 gene generates two major transcripts via alternative splicing, that encode the same coding region but differ in their 3′-UTRs. The generation of the two variant transcripts was confirmed by reverse transcriptase-PCR using DNA-free RNA from thymus and three different primer sets, as described in the Materials and methods section. The location of the forward (F) and reverse (R) primers is indicated in (B). The primer sets F1/R1, F1/R2 and F2/R3 each generated a PCR product of the size predicted by the genomic structure (C). In (A), the location of the 5 common introns is indicated by open arrows; the start of the alternative intron 6 is indicated by the filled arrow.
Figure 2. Multiple amino acid sequence alignment of mouse (m) and human (h) NABP1 and NABP2, the Xenopus (x) homologue of NABP2, and the putative Drosophila (d) NABP homologue
(A) The OB-fold domain is shaded. (-) indicates sequence identity with mNABP1; (.) indicates a gap. The β-strands are indicated by black bars. (B) Phylogenetic relationship between NABP1 and NABP2 from different species.
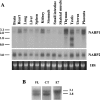
Figure 3. Tissue-specific expression of NABP1 and NABP2 mRNA
(A) Total RNA from various mouse tissues was examined by Northern blot analysis using radiolabelled probes for NABP1 and NABP2. The sizes (kb) of the NABP transcripts are indicated on the left. (B) The NABP1 gene generates two major transcripts via alternative splicing. The generation of these two transcripts was confirmed by Northern blot analysis using probes encoding the full-length (FL) NABP1 cDNA AY880264, the C-terminal (CT) half of the coding region of NABP1, and exon 7 (E7). The CT probe hybridizes to both transcripts whereas the E7 probe detects only the larger transcript, which is in agreement with the alternative splicing shown in Figure 1(B).
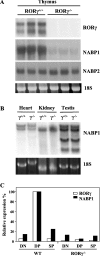
Figure 4. Expression of NABP1 mRNA is suppressed in the thymus of RORγ−/− mice
(A) Total RNA was isolated from thymi of wild-type (RORγ+/+) and RORγ−/− mice, and then examined by Northern blot analysis using radiolabelled probes for RORγ, NABP1 and NABP2. In each case tissues from three different mice were analysed. (B) RORγ does not regulate NABP1 expression in heart, kidney and testis. Total RNA was isolated from heart, kidney and testis of wild-type (RORγ+/+) and RORγ−/− mice, and then examined by Northern blot analysis using radiolabelled probes for RORγ. (C) NABP1 mRNA is abundant in CD4+CD8+ (DP) thymocytes. Total RNA was isolated from CD4−CD8− (double negative, DN), DP, and CD4+ and CD8+ (single positive, SP) thymocytes from wild-type and RORγ−/− mice. The expression of NABP1 and RORγ mRNA was quantified by real-time reverse transcriptase-PCR as described in the Materials and methods section. The locations of the primers and probe are indicated in Figure 1(A).
Figure 5. Subcellular localization of NABP1 protein. 3XFLAG–NABP1, 3XFLAG–NABP1ΔN, and 3XFLAG–NABP1ΔC fusion proteins were stably expressed in CV-1 cells
The subcellular localization of these proteins was examined by confocal microscopy using a mouse anti-Flag M2 antibody and an AlexaFluor® 594 goat anti-(mouse IgG) antibody (B, D and F) as described in the Materials and methods section. Nuclei were identified by DAPI staining (A, C and E). (A) and (B), 3XFLAG–NABP1; (C) and (D), 3XFLAG–NABP1ΔC; (E) and (F), 3XFLAG–NABP1ΔN.
Figure 6. NABP1 is part of a high-molecular-mass protein complex
Nuclear lysates were isolated from CV-1 cells stably expressing the FLAG–NABP1 fusion protein. Proteins were then separated by Sephacryl 300HR size-exclusion chromatography. The column was calibrated using Blue Dextran (2000 kDa), β-amylase (200 kDa), yeast alcohol dehydrogenase (150 kDa), FBS (66 kDa) and carbonic hydrase (29 kDa) as molecular-mass standards. The arrows indicate the fraction number at which these standards were eluted. Samples of each fraction were examined by immuno dot-blot analysis for the presence of the FLAG–NABP1 protein. The level of immunostaining was quantified and plotted as the relative level of FLAG–NABP1 protein. In addition, samples from several fractions were examined by Western blot analysis with the anti-Flag M2 antibody as shown in the inset.
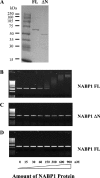
Figure 7. NABP1 protein binds single-stranded, but not double-stranded, DNA
(A) PAGE of purified MBP–NABP1(full-length, FL) (lane 2) and MBP–NABP1ΔN (lane 3) fusion proteins. Molecular-mass markers were run in lane 1. Protein was identified by Coomassie Brilliant Blue staining. Both proteins migrated as single bands of the expected molecular mass. (B)–(D) Single-stranded ΦX174 viral DNA (B and C), and double-stranded DNA (D) were incubated with increasing amounts of MBP–NABP1(FL) or MBP–NABP1ΔN fusion proteins at the concentrations indicated and were then analysed by 0.8% agarose gel electrophoresis as described in the Materials and methods section.
Figure 8. NABP1 protein binds to RNA
Total cellular RNA (0.5 μg) was incubated for 20 min at room temperature with MBP–NABP1 or MBP–NABP1ΔN fusion proteins at the concentrations indicated. The reaction mixture was separated on a 0.8% agarose gel and then visualized by ethidium bromide staining. FL, full-length; CT, C-terminal.
Figure 9. Binding of NABP1 to single-stranded oligonucleotides
(A) Single-stranded 32P-labelled oligonucleotides, 10, 20, 30, 50 and 80 nt in length (dN10–dN80), were incubated with increasing concentrations of NABP1 and then analysed by EMSA. (B) The fraction of bound (shifted) DNA was measured by a Fluorskan 8900 apparatus. (C) Binding of NABP1 to 32P-labelled single-stranded dG35, dA35, dT35 and dC35.
Similar articles
- TOR: a new orphan receptor expressed in the thymus that can modulate retinoid and thyroid hormone signals.
Ortiz MA, Piedrafita FJ, Pfahl M, Maki R. Ortiz MA, et al. Mol Endocrinol. 1995 Dec;9(12):1679-91. doi: 10.1210/mend.9.12.8614404. Mol Endocrinol. 1995. PMID: 8614404 - Retinoid-related orphan receptor gamma (RORgamma) is essential for lymphoid organogenesis and controls apoptosis during thymopoiesis.
Kurebayashi S, Ueda E, Sakaue M, Patel DD, Medvedev A, Zhang F, Jetten AM. Kurebayashi S, et al. Proc Natl Acad Sci U S A. 2000 Aug 29;97(18):10132-7. doi: 10.1073/pnas.97.18.10132. Proc Natl Acad Sci U S A. 2000. PMID: 10963675 Free PMC article. - C-termini are essential and distinct for nucleic acid binding of human NABP1 and NABP2.
Vidhyasagar V, He Y, Guo M, Ding H, Talwar T, Nguyen V, Nwosu J, Katselis G, Wu Y. Vidhyasagar V, et al. Biochim Biophys Acta. 2016 Feb;1860(2):371-83. doi: 10.1016/j.bbagen.2015.11.003. Epub 2015 Nov 10. Biochim Biophys Acta. 2016. PMID: 26550690 - Nucleic acid recognition by OB-fold proteins.
Theobald DL, Mitton-Fry RM, Wuttke DS. Theobald DL, et al. Annu Rev Biophys Biomol Struct. 2003;32:115-33. doi: 10.1146/annurev.biophys.32.110601.142506. Epub 2003 Feb 18. Annu Rev Biophys Biomol Struct. 2003. PMID: 12598368 Free PMC article. Review. - Orphan nuclear receptors in T lymphocyte development.
He YW. He YW. J Leukoc Biol. 2002 Sep;72(3):440-6. J Leukoc Biol. 2002. PMID: 12223510 Review.
Cited by
- Conditional ablation of mediator subunit MED1 (MED1/PPARBP) gene in mouse liver attenuates glucocorticoid receptor agonist dexamethasone-induced hepatic steatosis.
Jia Y, Viswakarma N, Fu T, Yu S, Rao MS, Borensztajn J, Reddy JK. Jia Y, et al. Gene Expr. 2009;14(5):291-306. doi: 10.3727/105221609788681213. Gene Expr. 2009. PMID: 19630272 Free PMC article. - DNA-dependent phase separation by human SSB2 (NABP1/OBFC2A) protein points to adaptations to eukaryotic genome repair processes.
Kovács ZJ, Harami GM, Pálinkás J, Kuljanishvili N, Hegedüs J, Harami-Papp H, Mahmudova L, Khamisi L, Szakács G, Kovács M. Kovács ZJ, et al. Protein Sci. 2024 Apr;33(4):e4959. doi: 10.1002/pro.4959. Protein Sci. 2024. PMID: 38511671 Free PMC article. - Prednisolone-induced differential gene expression in mouse liver carrying wild type or a dimerization-defective glucocorticoid receptor.
Frijters R, Fleuren W, Toonen EJ, Tuckermann JP, Reichardt HM, van der Maaden H, van Elsas A, van Lierop MJ, Dokter W, de Vlieg J, Alkema W. Frijters R, et al. BMC Genomics. 2010 Jun 5;11:359. doi: 10.1186/1471-2164-11-359. BMC Genomics. 2010. PMID: 20525385 Free PMC article. - hSSB2 (NABP1) is required for the recruitment of RPA during the cellular response to DNA UV damage.
Boucher D, Kariawasam R, Burgess J, Gimenez A, Ocampo TE, Ferguson B, Naqi A, Walker GJ, Bolderson E, Gamsjaeger R, O'Byrne KJ, Cubeddu L, Khanna KK, Richard DJ. Boucher D, et al. Sci Rep. 2021 Oct 12;11(1):20256. doi: 10.1038/s41598-021-99355-0. Sci Rep. 2021. PMID: 34642383 Free PMC article. - The Role of Pumilio RNA Binding Protein in Plants.
Huh SU. Huh SU. Biomolecules. 2021 Dec 9;11(12):1851. doi: 10.3390/biom11121851. Biomolecules. 2021. PMID: 34944494 Free PMC article. Review.
References
- Jetten A. M. Recent Advances in the Mechanisms of Action and Physiological Functions of the Retinoid-related Orphan Receptors (RORs) Current Drug Targets. Inflammation and Allergy. 2004;3:395–412. - PubMed
- He Y. W. Orphan nuclear receptors in T lymphocyte development. J. Leukoc. Biol. 2002;72:440–446. - PubMed
- Eberl G., Littman D. R. The role of the nuclear hormone receptor RORγt in the development of lymph nodes and Peyer's patches. Immunol. Rev. 2003;195:81–90. - PubMed
- Jetten A. M., Kurebayashi S., Ueda E. The ROR nuclear orphan receptor subfamily: critical regulators of multiple biological processes. Prog. Nucleic Acid Res. Mol. Biol. 2001;69:205–227. - PubMed
Publication types
MeSH terms
Substances
LinkOut - more resources
Full Text Sources
Other Literature Sources
Molecular Biology Databases
Research Materials
Miscellaneous


