The CB1 cannabinoid receptor is the major cannabinoid receptor at excitatory presynaptic sites in the hippocampus and cerebellum - PubMed (original) (raw)
Comparative Study
The CB1 cannabinoid receptor is the major cannabinoid receptor at excitatory presynaptic sites in the hippocampus and cerebellum
Yoshinobu Kawamura et al. J Neurosci. 2006.
Abstract
Endocannabinoids work as retrograde messengers and contribute to short-term and long-term modulation of synaptic transmission via presynaptic cannabinoid receptors. It is generally accepted that the CB1 cannabinoid receptor (CB1) mediates the effects of endocannabinoid in inhibitory synapses. For excitatory synapses, however, contributions of CB1, "CB3," and some other unidentified receptors have been suggested. In the present study we used electrophysiological and immunohistochemical techniques and examined the type(s) of cannabinoid receptor functioning at hippocampal and cerebellar excitatory synapses. Our electrophysiological data clearly demonstrate the predominant contribution of CB1. At hippocampal excitatory synapses on pyramidal neurons the cannabinoid-induced synaptic suppression was reversed by a CB1-specific antagonist, N-(piperidin-1-yl)-5-(4-iodophenyl)-1-(2,4-dichlorophenyl)-4-methyl-1H-pyrazole-3-carboxamide (AM251), and was absent in CB1 knock-out mice. At climbing fiber (CF) and parallel fiber (PF) synapses on cerebellar Purkinje cells the cannabinoid-dependent suppression was absent in CB1 knock-out mice. The presence of CB1 at presynaptic terminals was confirmed by immunohistochemical experiments with specific antibodies against CB1. In immunoelectron microscopy the densities of CB1-positive signals in hippocampal excitatory terminals and cerebellar PF terminals were much lower than in inhibitory terminals but were clearly higher than the background. Along the long axis of PFs, the CB1 was localized at a much higher density on the perisynaptic membrane than on the extrasynaptic and synaptic regions. In contrast, CB1 density was low in CF terminals and was not significantly higher than the background. Despite the discrepancy between the electrophysiological and morphological data for CB1 expression on CFs, these results collectively indicate that CB1 is responsible for cannabinoid-dependent suppression of excitatory transmission in the hippocampus and cerebellum.
Figures
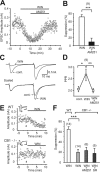
Figure 1.
CB1 dependence of cannabinoid-induced suppression of excitatory transmission in hippocampal slices of young mice. A, Representative results showing WIN55,212-2-induced (2 μ
m
) suppression of EPSCs and its reversal by AM251 (2 μ
m
). B, Averaged data for percentage suppression of EPSC amplitudes by WIN55,212-2 (2 μ
m
) and WIN55,212-2 (2 μ
m
) plus AM251 (2 μ
m
). C, Sample traces of EPSC evoked by paired stimuli (50 ms interval) before (cont.) and during the application of WIN55,212-2 (2 μ
m
). Traces scaled to the amplitude of the first EPSC are shown at the bottom. Each trace is the average of 24 consecutive EPSCs. D, Averaged data for the paired pulse ratio of EPSCs obtained before (cont.) and during the application of WIN55,212-2 (2 μ
m
) and after the additional application of AM251 (2 μ
m
). E, Representative results showing effects of WIN55,212-2 (2 μ
m
) on EPSCs in wild-type (WT) and CB1 knock-out (CB1−/−) mice. Sample EPSC traces (a, b) were obtained at the time points indicated in the graphs. Calibration: 50 pA, 10 ms. F, Summary bar graph for percentage suppression of EPSC amplitudes by WIN55,212-2 (2 μ
m
) in wild-type mice (WT) and by WIN55,212-2 (2 μ
m
), WIN55,212-2 (2 μ
m
) plus AM251 (2 μ
m
), and WIN55,212-2 (2 μ
m
) plus SR141716A (2 μ
m
) in CB1 knock-out mice (CB1−/−). The numbers of tested cells are indicated in parentheses in B, D, and F. Error bars indicate the mean ± SEM; *p < 0.05, **p < 0.01, and ***p < 0.001.
Figure 2.
CB1-dependent suppression of EPSCs in hippocampal slices from young adult (A–C) and adult (D–F) mice. A, B, D, E, Representative results showing effects of WIN55,212-2 (2 μ
m
) on EPSC amplitudes in wild-type (WT) and CB1 knock-out (CB1−/−) mice. EPSC traces (a, b) obtained at the time points indicated in each graph are superimposed (top). Calibration: 50 pA, 10 ms. C, Summary bar graph for suppression of EPSC amplitudes by WIN55,212-2 (2 μ
m
) and WIN55,212-2 (2 μ
m
) plus AM251 (2 μ
m
) in wild-type (WT) and by WIN55,212-2 (2 μ
m
) in CB1 knock-out (CB1−/−) mice. F, Summary bar graph for suppression of EPSC amplitudes by WIN55,212-2 (2 μ
m
) in each genotype. The number of tested cells are indicated in parentheses in C and F. Error bars indicate the mean ± SEM; ***p < 0.001.
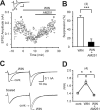
Figure 3.
Reversal of cannabinoid-induced suppression of EPSCs by AM251 in rat hippocampal slices. A, Representative case showing WIN55,212-2-induced (2 μ
m
) suppression of EPSCs and its reversal by AM251 (2 μ
m
). EPSC traces (a–c) acquired at the time points indicated in the graph are superimposed (top). Calibration: 50 pA, 10 ms. B, Summary bar graph for percentage suppression of EPSC amplitudes by WIN55,212-2 (2 μ
m
) and WIN55,212-2 (2 μ
m
) plus AM251 (2 μ
m
). C, Sample traces of EPSCs evoked by paired stimuli before (cont.) and during the application of WIN55,212-2 (2 μ
m
). D, Averaged data for paired pulse ratio of EPSCs obtained under the indicated conditions. The number of tested cells are indicated in parentheses in B and D. Error bars indicate the mean ± SEM; *p < 0.05 and ***p < 0.001.
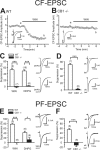
Figure 4.
CB1 dependence of cannabinoid-induced suppression of CF and PF inputs to cerebellar PCs. A, B, Representative results showing effects of WIN55,212-2 (5 μ
m
) on CF-EPSCs in wild-type (WT, A) and CB1 knock-out (CB1−/−, B) mice. Sample EPSC traces (a, b) were obtained at the time points indicated in the graphs. Each trace is an average of six consecutive EPSCs. C, Summary bar graph showing the effects of WIN55,212-2 (5 μ
m
) and DHPG (50 μ
m
) on CF-EPSCs in wild-type and CB1 knock-out mice. CF-EPSC traces obtained before (cont.) and during the application of DHPG are superimposed (right). D, Averaged data for depolarization-induced suppression of CF-EPSCs in each genotype. The suppression was induced by five short voltage steps (100 ms; 0 mV, 1 Hz). CF-EPSC traces obtained 5 s before (bef.) and 5 s after (aft.) depolarization are superimposed (right). E, Summary bar graph showing the effects of WIN55,212-2 (5 μ
m
) and DHPG (50 μ
m
) on PF-EPSCs in wild-type and CB1 knock-out mice. PF-EPSC traces obtained before (cont.) and during the application of WIN55,212-2 (WIN) are superimposed (right). F, Averaged data for depolarization-induced suppression of PF-EPSCs in each genotype. PF-EPSC traces obtained 5 s before (bef.) and 5 s after (aft.) depolarization are superimposed (right). The numbers of tested cells are indicated in parentheses in C–F. Error bars indicate the mean ± SEM; *p < 0.05 and ***p < 0.001.
Figure 5.
Confocal laser-scanning microscopy showing distribution of CB1 in the adult hippocampus. A–F, Immunofluorescence for CB1 (red), VGAT (green), and VGluT1 (blue) in the CA1 (A, B), CA3 (C, D), and dentate gyrus (DG; E, F). G, H, Immunofluorescence for CB1 (red), calretinin (green), and VGluT1 (blue) in the DG. Note calretinin-positive neurons in the polymorphic layer (PM) and their terminal distribution in the basal zone of the molecular layer (Mo). I–K, CB1 labeling (red) by raising the antibody concentration. Shown are images from wild-type (I, J) and CB1 knock-out (K) hippocampi with antibody concentrations of 3 μg/ml (I) and 10 μg/ml (J, K). Gr, Granule cell layer; LM, stratum lacunosum-moleculare; Lu, stratum lucidum; Or, stratum oriens; Py, pyramidal cell layer; Ra, stratum radiatum. Scale bars, 10 μm.
Figure 6.
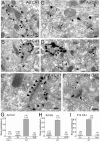
Immunoelectron microscopy showing subcellular and synaptic localization of CB1 in the hippocampus at adult (A–D, G, H) and P14 (E, F, I). A–F, Preembedding silver-enhanced immunogold for CB1 in the stratum radiatum of the hippocampal CA1 region (A–C, E, F) and in the innermost molecular layer of the dentate gyrus (D). Arrowheads and arrows indicate symmetrical and asymmetrical synapses, respectively. G–I, Summary bar graphs showing the number of silver particles per 1 μm of plasma membrane in excitatory terminals (Ex), inhibitory terminals (In), pyramidal cell dendrite (PyD), and granule cell dendrites (GCD) in the hippocampal CA1 (G, I) and dentate gyrus (DG; H). In wild-type mice (WT) the densities in excitatory and inhibitory terminals were significantly higher (p < 0.05) than the background level of PyD or GCD (G, H, I). Furthermore, the density in excitatory terminals in adult wild-type mice was significantly higher (p < 0.01) than the noise level, which was estimated from immunogold particle density in excitatory terminals of CB1 knock-out mice (G). The numbers in and out of parentheses on the top of each column (G–I) indicate the sample size and the mean density of silver particles, respectively. Dn, Dendrite; IDn, interneuronal dendrite; S, dendritic spine. Scale bars, 100 nm. Error bars indicate the mean ± SEM.
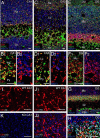
Figure 7.
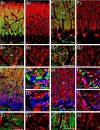
Confocal laser-scanning microscopy showing distribution of CB1 in the cerebellar cortex at P14 (A–E) and adult (F–J). A, B, F, G, Immunofluorescence for CB1 (red) and VGluT1 (green). C, D, H, I, Immunofluorescence for CB1 (red), VGluT2 (green), and VGAT (blue). Yellow arrows indicate VGluT2-labeled CF terminals lacking CB1 labeling, whereas white arrowheads indicate VGAT-labeled inhibitory terminals carrying CB1 labeling. Asterisks in F1 and H indicate the pinceau formation. E, J, Immunofluorescence for CB1 (red) and GLAST (green). Gr, Granular layer; Mo, molecular layer. Scale bars, 10 μm.
Figure 8.
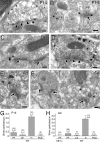
Immunoelectron microscopy showing localization of CB1 in the cerebellar molecular layer at P14 (A–C, G) and adult (D–F, H). A–F, Preembedding silver-enhanced immunogold for CB1 in the cerebellar cortex, using parasagittal cerebellar sections. Arrowheads and arrows indicate symmetrical and asymmetrical synapses, respectively. G, H, Summary bar graphs showing the number of silver particles per 1 μm of plasma membrane in PF, CF, inhibitory terminals (In), and PC dendrites (PCD). In wild-type mice (WT), the densities in PF and In were significantly higher (p < 0.05) than the background level of PCD (G, H). Furthermore, the density in PF in adult wild-type mice was significantly higher (p < 0.01) than the noise level, which was estimated from immunogold particle density in PF terminals of CB1 knock-out mice (H). In contrast, the immunogold particle density in CF was not significantly higher than the background level at P14 and in adult (G, H), or the noise level in adult (H). The numbers in and out of parentheses on the top of each column (G, H) indicate the sample size and the mean density of silver particles. Scale bars, 100 nm. Error bars indicate the mean ± SEM.
Figure 9.
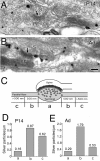
Preferential perisynaptic localization of CB1 along PFs at P14 (A, D) and adult (B, E). Shown is CB1 distribution along longitudinally sectioned PFs at P14 (A) and adult (B). Arrows indicate asymmetrical synaptic junction with PC spines (S). C, Scheme for illustrating segmented measurement of synaptic (a), perisynaptic (b), and extrasynaptic (c) distributions of CB1 along PFs. D, E, Summary bar graphs showing the density of CB1 at synaptic (a), perisynaptic (b), and extrasynaptic (c) regions at P14 (D) and adult (E). The number on the top of each column (D, E) indicates the mean density of silver particles. Scale bar, 100 nm.
Similar articles
- Cannabinoid receptor modulation of synapses received by cerebellar Purkinje cells.
Takahashi KA, Linden DJ. Takahashi KA, et al. J Neurophysiol. 2000 Mar;83(3):1167-80. doi: 10.1152/jn.2000.83.3.1167. J Neurophysiol. 2000. PMID: 10712447 - Involvement of cannabinoid receptors in the regulation of neurotransmitter release in the rodent striatum: a combined immunochemical and pharmacological analysis.
Köfalvi A, Rodrigues RJ, Ledent C, Mackie K, Vizi ES, Cunha RA, Sperlágh B. Köfalvi A, et al. J Neurosci. 2005 Mar 16;25(11):2874-84. doi: 10.1523/JNEUROSCI.4232-04.2005. J Neurosci. 2005. PMID: 15772347 Free PMC article. - Presynaptic cannabinoid sensitivity is a major determinant of depolarization-induced retrograde suppression at hippocampal synapses.
Ohno-Shosaku T, Tsubokawa H, Mizushima I, Yoneda N, Zimmer A, Kano M. Ohno-Shosaku T, et al. J Neurosci. 2002 May 15;22(10):3864-72. doi: 10.1523/JNEUROSCI.22-10-03864.2002. J Neurosci. 2002. PMID: 12019305 Free PMC article. - Retrograde endocannabinoid signaling in the cerebellar cortex.
Safo PK, Cravatt BF, Regehr WG. Safo PK, et al. Cerebellum. 2006;5(2):134-45. doi: 10.1080/14734220600791477. Cerebellum. 2006. PMID: 16818388 Review. - Distinct cannabinoid sensitive receptors regulate hippocampal excitation and inhibition.
Hájos N, Freund TF. Hájos N, et al. Chem Phys Lipids. 2002 Dec 31;121(1-2):73-82. doi: 10.1016/s0009-3084(02)00149-4. Chem Phys Lipids. 2002. PMID: 12505692 Review.
Cited by
- Behavioral and Molecular Responses to Exogenous Cannabinoids During Pentylenetetrazol-Induced Convulsions in Male and Female Rats.
Zirotti Rosenberg A, Méndez-Ruette M, Gorziglia M, Alzerreca B, Cabello J, Kaufmann S, Rambousek L, Iturriaga Jofré A, Wyneken U, Lafourcade CA. Zirotti Rosenberg A, et al. Front Mol Neurosci. 2022 Aug 9;15:868583. doi: 10.3389/fnmol.2022.868583. eCollection 2022. Front Mol Neurosci. 2022. PMID: 36147210 Free PMC article. - Supraspinal Mechanisms of Intestinal Hypersensitivity.
Lyubashina OA, Sivachenko IB, Panteleev SS. Lyubashina OA, et al. Cell Mol Neurobiol. 2022 Mar;42(2):389-417. doi: 10.1007/s10571-020-00967-3. Epub 2020 Oct 8. Cell Mol Neurobiol. 2022. PMID: 33030712 Review. - Tat-Cannabinoid Receptor Interacting Protein Reduces Ischemia-Induced Neuronal Damage and Its Possible Relationship with 14-3-3η.
Kwon HJ, Kim DS, Kim W, Jung HY, Yu YH, Ju YI, Park DK, Hwang IK, Kim DW, Yoo DY. Kwon HJ, et al. Cells. 2020 Aug 3;9(8):1827. doi: 10.3390/cells9081827. Cells. 2020. PMID: 32756411 Free PMC article. - Genetic dissection of behavioural and autonomic effects of Delta(9)-tetrahydrocannabinol in mice.
Monory K, Blaudzun H, Massa F, Kaiser N, Lemberger T, Schütz G, Wotjak CT, Lutz B, Marsicano G. Monory K, et al. PLoS Biol. 2007 Oct;5(10):e269. doi: 10.1371/journal.pbio.0050269. PLoS Biol. 2007. PMID: 17927447 Free PMC article.
References
- Alger BE (2002). Retrograde signaling in the regulation of synaptic transmission: focus on endocannabinoids. Prog Neurobiol 68:247–286. - PubMed
- Begg M, Pacher P, Batkai S, Osei-Hyiaman D, Offertaler L, Mo FM, Liu J, Kunos G (2005). Evidence for novel cannabinoid receptors. Pharmacol Ther 106:133–145. - PubMed
Publication types
MeSH terms
Substances
LinkOut - more resources
Full Text Sources
Molecular Biology Databases
