Remodeling of synaptic structure in sensory cortical areas in vivo - PubMed (original) (raw)
Remodeling of synaptic structure in sensory cortical areas in vivo
Ania K Majewska et al. J Neurosci. 2006.
Abstract
Although plastic changes are known to occur in developing and adult cortex, it remains unclear whether these changes require remodeling of cortical circuitry whereby synapses are formed and eliminated or whether they rely on changes in the strength of existing synapses. To determine the structural stability of dendritic spines and axon terminals in vivo, we chose two approaches. First, we performed time-lapse two-photon imaging of dendritic spine motility of layer 5 pyramidal neurons in juvenile [postnatal day 28 (P28)] mice in visual, auditory, and somatosensory cortices. We found that there were differences in basal rates of dendritic spine motility of the same neuron type in different cortices, with visual cortex exhibiting the least structural dynamics. Rewiring visual input into the auditory cortex at birth, however, failed to alter dendritic spine motility, suggesting that structural plasticity rates might be intrinsic to the cortical region. Second, we investigated the persistence of both the presynaptic (axon terminals) and postsynaptic (dendritic spine) structures in young adult mice (P40-P61), using chronic in vivo two-photon imaging in different sensory areas. Both terminals and spines were relatively stable, with >80% persisting over a 3 week period in all sensory regions. Axon terminals were more stable than dendritic spines. These data suggest that changes in network function during adult learning and memory might occur through changes in the strength and efficacy of existing synapses as well as some remodeling of connectivity through the loss and gain of synapses.
Figures
Figure 1.
Imaging dendritic spines in vivo in different sensory areas. A, Images of the apical tuft of a layer 5 pyramidal neuron in auditory cortex from a P28 animal taken using two-photon microscopy. Top, Collapsed Z stack showing the dendritic arbor (top view). Bottom, Three-dimensional reconstruction showing the dendritic arbor from the side. Scale bar, 50 μm. B, Two-photon images of dendritic spines in vivo from dendrite shown in A (boxed area). Scale bar, 5 μm. C, In vivo image of dendritic section from primary visual cortex of a P28 animal taken at different time points. The time in minutes is indicated in the top right corner of each panel. Scale bar, 5 μm. D, Graph showing the lengths (from tip to dendrite) over a 2 h period of five protrusions numbered in A. Notice that motile spines such 1 and 5 can be situated next to immotile spines (2–4).
Figure 2.
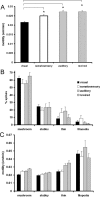
Spine motility is higher in auditory and somatosensory cortices than in visual cortex. A, Graph showing spine motility in visual, somatosensory, and auditory cortices. Spine motility in auditory and somatosensory cortices is significantly higher (*p < 0.001) than in visual cortex. Rewiring visual input into auditory cortex does not alter spine motility. B, Graph showing dendritic spine class distributions in different cortical areas. In all areas at these ages, mushroom spines are most common, with a smaller proportion of thin and stubby spines. Filopodia are rare at these ages, although somatosensory cortex maintains a higher proportion of these immature protrusions (∼15% of all protrusions). C, Spine motility of all spine classes is upregulated in auditory cortex compared with visual cortex (p < 0.05). The motility of mushroom spines is upregulated in somatosensory cortex compared with visual cortex (p < 0.001). Filopodia are highly motile in all regions studied.
Figure 3.
Low turnover rates of dendritic spines in young adult cortex. A, In vivo images of layer 5 apical dendrites taken during chronic imaging experiments in auditory cortex. Images are projected in two dimensions from 50 Z sections taken 3 μm apart. Scale bar, 50 μm. Left, First time point at P40. Right, Second time point at P61. B, In vivo images of dendritic structure taken during chronic imaging experiments in somatosensory (left) and visual (right) cortices. Images are projected in two dimensions from Z sections taken 1 μm apart. Scale bar, 5 μm. Notice that, after 3 weeks, the same dendritic spines can easily be identified. Arrows in the top panels mark spines that are lost, and arrows in the bottom panels mark spines that are formed de novo. C, Graphs showing turnover of dendritic spines in different cortical areas after a 1 week period (left) and after a 3 week period (right). Eighty to 90% of dendritic spines can be reidentified during the second imaging session under these conditions. No statistically significant differences in turnover can be observed between different sensory regions. A1, Auditory cortex; V1, visual cortex; S1, somatosensory cortex.
Figure 4.
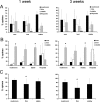
Thin spines are less stable than mushroom and stubby spines. A, Mushroom spines make up the majority of stable spines in both the 1 week (left) and 3 week (right) imaging periods (p < 0.001). Thin spines are least likely to be stable over this imaging interval (p < 0.001). Data presented are the percentage of each spine class that comprise all new, lost, and stable spines (e.g., the number of mushroom spines that are stable normalized to the number of all stable protrusions observed). B, Mushroom and stubby spines observed on the first day of imaging are most likely to be reidentified in the second imaging session (left, 1 week; right, 3 weeks). Thin spines are more likely to be lost and also to be formed than either mushroom or stubby spines (*p < 0.05). Very few filopodia remain stable during the imaging interval. Data presented are the percentage of new, lost, and gained spines in each spine class. C, Morphological changes occur in stable spines. Graph showing the percentage of stable spines of each spine class that maintain their morphological classification at 1 week (left) and 3 week (right) imaging intervals. The majority (80–90%) of mushroom spines maintain mushroom-like morphologies over time, whereas significantly fewer (50–70%; *p < 0.005) thin spines remain thin. Notice that fewer spines in all classes maintain their morphological classification over the 3 week than the 1 week imaging interval.
Figure 5.
Low turnover rates of axon terminals in young adult cortex. A, In vivo images of layer 5 apical dendrites taken during chronic imaging experiments in visual cortex. Images are projected in two dimensions from 50 Z sections taken 3 μm apart. Scale bar, 50 μm. Left, First time point at P40. Right, Second time point at P61. B, In vivo images of axonal structure taken during chronic imaging experiments in somatosensory (left) and visual (right) cortices. Images are projected in two dimensions from Z sections taken 1 μm apart. Scale bar, 5 μm. Notice that, after 3 weeks, the same axon terminals can easily be identified. Arrows in the top panels mark terminals that are lost, and arrows in the bottom panels mark terminals that are formed de novo. C, Graphs showing turnover of axon terminals in different cortical regions after a 1 week period (left) and after a 3 week period (right panel). Ninety to 95% of terminals can be reidentified during the second imaging session under these conditions. Axon terminals were very stable in all sensory areas studied. A1, Auditory cortex; V1, visual cortex; S1, somatosensory cortex.
Figure 6.
Dendritic spines show higher rates of turnover than axon terminals. A, Dendritic spines were more stable then axon terminals at both 1 and 3 week imaging intervals. Spines were more likely to be lost during the imaging period, and rates of loss were higher for dendritic spines than axon terminals. *p < 0.05. B, Graph plotting the percentage of stable terminals versus stable spines in individual imaged areas from different animals. Notice that axon terminals are more likely to be stable than nearby dendritic spines. C, Graph plotting the percentage of new (black diamonds) and lost (white squares) axon terminals in each imaged region versus the percentage of new and lost dendritic spines in the same region. Dendritic spines are more likely to be lost during the imaging session than axon terminals.
Figure 7.
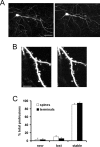
Dendritic spine turnover in layer 2/3 neurons. A, In vivo images of a layer 2/3 neuron in somatosensory cortex taken 1 week apart. Images are collapsed from Z sections taken 3 μm apart. Scale bar, 50 μm. B, Dendritic sections from neuron in A. Notice that most of the same spines can be reidentified after a 1-week-long period. Images are collapsed from Z sections taken 1 μm apart. Scale bar, 5 μm. C, Graph showing percentages of stable, new, and lost spines. More than 90% of spines can be reidentified over a 1-week-long period, suggesting that persistence may be a general property of cortical spines located on pyramidal neurons.
Similar articles
- Maternal Loss of Ube3a Impairs Experience-Driven Dendritic Spine Maintenance in the Developing Visual Cortex.
Kim H, Kunz PA, Mooney R, Philpot BD, Smith SL. Kim H, et al. J Neurosci. 2016 Apr 27;36(17):4888-94. doi: 10.1523/JNEUROSCI.4204-15.2016. J Neurosci. 2016. PMID: 27122043 Free PMC article. - Imaging of experience-dependent structural plasticity in the mouse neocortex in vivo.
Holtmaat A, De Paola V, Wilbrecht L, Knott GW. Holtmaat A, et al. Behav Brain Res. 2008 Sep 1;192(1):20-5. doi: 10.1016/j.bbr.2008.04.005. Epub 2008 Apr 18. Behav Brain Res. 2008. PMID: 18501438 - Chronic 2P-STED imaging reveals high turnover of dendritic spines in the hippocampus in vivo.
Pfeiffer T, Poll S, Bancelin S, Angibaud J, Inavalli VK, Keppler K, Mittag M, Fuhrmann M, Nägerl UV. Pfeiffer T, et al. Elife. 2018 Jun 22;7:e34700. doi: 10.7554/eLife.34700. Elife. 2018. PMID: 29932052 Free PMC article. - Experience-dependent structural plasticity in the cortex.
Fu M, Zuo Y. Fu M, et al. Trends Neurosci. 2011 Apr;34(4):177-87. doi: 10.1016/j.tins.2011.02.001. Trends Neurosci. 2011. PMID: 21397343 Free PMC article. Review. - Morphological plasticity of postsynaptic neurones in reactive synaptogenesis.
Hamori J. Hamori J. J Exp Biol. 1990 Oct;153:251-60. doi: 10.1242/jeb.153.1.251. J Exp Biol. 1990. PMID: 2280223 Review.
Cited by
- Opposing Effects of Neuronal Activity on Structural Plasticity.
Fauth M, Tetzlaff C. Fauth M, et al. Front Neuroanat. 2016 Jun 28;10:75. doi: 10.3389/fnana.2016.00075. eCollection 2016. Front Neuroanat. 2016. PMID: 27445713 Free PMC article. Review. - The long-term structural plasticity of cerebellar parallel fiber axons and its modulation by motor learning.
Carrillo J, Cheng SY, Ko KW, Jones TA, Nishiyama H. Carrillo J, et al. J Neurosci. 2013 May 8;33(19):8301-7. doi: 10.1523/JNEUROSCI.3792-12.2013. J Neurosci. 2013. PMID: 23658170 Free PMC article. - Dendritic Spines in Learning and Memory: From First Discoveries to Current Insights.
Heck N, Santos MD. Heck N, et al. Adv Neurobiol. 2023;34:311-348. doi: 10.1007/978-3-031-36159-3_7. Adv Neurobiol. 2023. PMID: 37962799 - Simultaneous analysis of dendritic spine density, morphology and excitatory glutamate receptors during neuron maturation in vitro by quantitative immunocytochemistry.
Nwabuisi-Heath E, LaDu MJ, Yu C. Nwabuisi-Heath E, et al. J Neurosci Methods. 2012 Jun 15;207(2):137-47. doi: 10.1016/j.jneumeth.2012.04.003. Epub 2012 Apr 10. J Neurosci Methods. 2012. PMID: 22521963 Free PMC article. - Reduced sensory-evoked structural plasticity in the aging barrel cortex.
Voglewede RL, Vandemark KM, Davidson AM, DeWitt AR, Heffler MD, Trimmer EH, Mostany R. Voglewede RL, et al. Neurobiol Aging. 2019 Sep;81:222-233. doi: 10.1016/j.neurobiolaging.2019.06.006. Epub 2019 Jun 26. Neurobiol Aging. 2019. PMID: 31323444 Free PMC article.
References
- Bonhoeffer T, Yuste R (2002). Spine motility. Phenomenology, mechanisms, and function. Neuron 35:1019–1027. - PubMed
- Deng J, Dunaevsky A (2005). Dynamics of dendritic spines and their afferent terminals: spines are more motile than presynaptic boutons. Dev Biol 2777:366–377. - PubMed
Publication types
MeSH terms
Substances
LinkOut - more resources
Full Text Sources


