Snf2/Swi2-related ATPase Mot1 drives displacement of TATA-binding protein by gripping DNA - PubMed (original) (raw)
Snf2/Swi2-related ATPase Mot1 drives displacement of TATA-binding protein by gripping DNA
Rebekka O Sprouse et al. EMBO J. 2006.
Abstract
Mot1 is a conserved Snf2/Swi2-related transcriptional regulator that uses ATP hydrolysis to displace TATA-binding protein (TBP) from DNA. Several models of the enzymatic mechanism have been proposed, including Mot1-catalyzed distortion of TBP structure, competition between Mot1 and DNA for the TBP DNA-binding surface, and ATP-driven translocation of Mot1 along DNA. Here, DNase I footprinting studies provide strong support for a 'DNA-based' mechanism of Mot1, which we propose involves ATP-driven DNA translocation. Mot1 forms an asymmetric complex with the TBP core domain (TBPc)-DNA complex, contacting DNA both upstream and within the major groove of the TATA Box. Contact with upstream DNA is required for Mot1-mediated displacement of TBPc from DNA. Using the SsoRad54-DNA complex as a model, DNA-binding residues in Mot1 were identified that are critical for Mot1-TBPc-DNA complex formation and catalytic activity, thus placing Mot1 mechanistically within the helicase superfamily. We also report a novel ATP-independent TBPc displacement activity for Mot1 and describe conformational heterogeneity in the Mot1 ATPase, which is likely a general feature of other enzymes in this class.
Figures
Figure 1
(A) A representative 12% protein gel showing the purified wild-type Mot1 protein used in these studies. The gel was stained with Coomassie blue and molecular weight standards are shown on the left. (B) Electrophoretic mobility shift assay using radiolabeled DNA (<1 nM) combined with 10 nM TBP where indicated. Unlabeled competitor TATA DNA was added prior to the addition of TBP (lane 3; 1st), or was incubated with preformed TBP–DNA complexes for the indicated times prior to loading on the gel (lanes 4–7). (−) indicates that the component was not added. The positions of the free DNA and TBP–DNA complex are shown on the left. Quantitation of the TBP–DNA complex revealed a dissociation half-time of ∼17 min (not shown). (C) An electrophoretic mobility shift experiment in which TBP (10 nM) was preincubated with radiolabeled DNA (<1 nM) as in (A), followed by addition of Mot1 (10 nM) to all reactions for 2 min. In lanes 3, 4, 7, and 8, unlabeled competitor TATA DNA was then added with or without 25 μM ATP for the indicated times prior to loading on the gel. Competitor DNA was added prior to TBP in the reactions in lanes 2 and 6. The positions of the free DNA, TBP–DNA, and Mot1–TBP–DNA complexes are indicated.
Figure 2
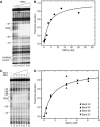
(A) An autoradiogram showing a DNase I footprint experiment in which TBPc was titrated to DNA. Lane 1 shows free DNA. Reactions in lanes 2–9 contained 0.25, 0.75, 2.0, 3.0, 5.0, 7.5, 12.6, or 25.1 nM TBPc, respectively. (B) Analysis of the experiment in (A), yielding an apparent _K_d of 3.8±0.6 nM for the TBPc–DNA interaction. Quantitation was performed by block analysis (Brenowitz et al, 1986) of the TATA band intensities normalized for differences in lane loading using the bands in the indicated region of the gel. (C) An autoradiogram showing a DNase I footprint titration experiment in which Mot1 was titrated to the TBPc–TATA complex. Lanes 1 and 8 show the free DNA. Lanes 2–7 included TBPc at 8.8 nM and Mot1 at 0.0, 0.4, 1.2, 4.1, 6.1, or 8.1 nM Mot1 for lanes 2–7, respectively. The positions of those upstream bands whose DNase I reactivity reflects only Mot1 binding are shown to the left of the autoradiogram (see Figure 3). A decrease in TATA Box protection upon addition of Mot1 was also observed; this is quantitated in Figure 3. (D) An isotherm calculated from (C) for the binding of Mot1 to the TBPc–DNA complex. The changes in density of the bands corresponding to nucleotides 37, 38, 42, and 43 quantitated individually were globally analyzed against the Langmuir polynomial to yield a best-fit value of _K_d=1.5±0.5 nM as depicted in the simulated curve.
Figure 3
A histogram showing quantitation of the relative intensity of the electrophoretic bands within and surrounding the TATA Box for DNA alone (blue), TBPc alone (black), and TBPc+Mot1 (orange) quantitated with single-nucleotide resolution. The data were derived from averaging lanes 1 and 8, or 2 and 7 of Figure 2C, respectively. The error bars on the free DNA data are the standard deviation of the average of the two lanes. The alterations in DNase I digestion pattern induced by TBP and Mot1 quantified here were observed in multiple independent experiments (not shown).
Figure 4
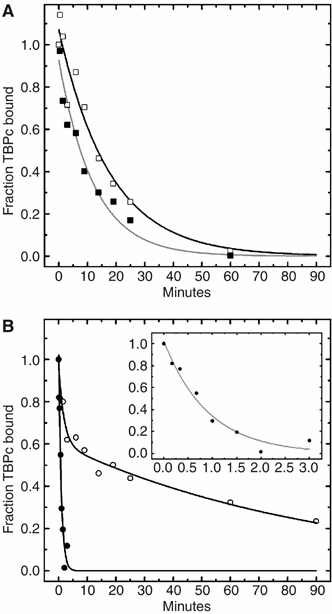
(A) The rate of TBPc dissociation was monitored by DNase I footprinting in the absence (open symbols) and presence (filled symbols) of 25 μM ATP. The half-time values determined for the best-fit to a single exponential decay are 17.9±1.8 and 12.2±1.2 min, respectively. (B) The rate of dissociation of the TBPc–Mot1–DNA complex in the absence (open symbols) and presence (solid symbols and insert) of 25 μM ATP. The ATP-mediated dissociation reaction is well described by a single exponential decay characterized by a half-time of 0.91±0.09 min. In contrast, the progress curve measured in the absence of ATP is biphasic and characterized by half-times of 1.8 (−0.5, +0.7) and 92.2 (−12.0, +17.0) min and amplitudes of 0.37±0.6 and 0.63±0.5, respectively. The fit of the data to a double compared with single exponential decay was significantly better as judged by the distribution of residuals (not shown) and _χ_2 values (2.18 × 10⁻³ versus 1.26 × 10⁻², respectively).
Figure 5
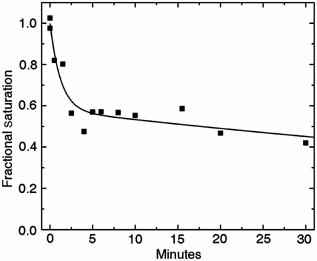
The rate of dissociation of TBPc–mot1–505–DNA complexes in the presence of 25 μM ATP. The progress curve is biphasic and characterized by half-times of 1.25 (−0.37, +0.48) and 120.1 (−47.9, +227.8) min and amplitudes of 0.42±0.06 and 0.58±0.05, respectively.
Figure 6
(A) Ribbon representation of Sso–Rad54 bound to DNA (Durr et al, 2005). View along the ATP binding cleft shows domain 1 (left) and domain 2 (right) connected by a flexible hinge (bottom). Homologous residues corresponding to mutations analyzed in this study are shown as colored spheres: mot1–24 (hinge region, yellow); mot1–505 (Walker B motif, cyan); mot1–508 and mot1–509 (DNA contacting residues in domain 1A; blue and magenta, respectively). (B) Model for Mot1 ATPase conformational change. Interaction of the ATPase with DNA (thick bar) is mediated primarily by residues in domain 1A. In the open conformation, domain 2A is oriented with ATP-binding residues pointing outward. An ∼180° rotation of domain 2A establishes the ATP binding cleft between domains 1A and 2A, and swings the Snf2/Swi2-specific 1B and 2B domains in position to push on DNA during the power stroke. A hinge connects the two pairs of domains and is the location of the R1507K mutation. Model is based on the SsoRad54–DNA structure (Durr et al, 2005) and the PcrA–DNA–AMPNP structure (Velankar et al, 1999). (C) DNase I footprinting experiment with reactions that contained 8.8 nM TBPc and/or 9 nM mot1–24 as indicated. Arrow indicates upstream protection induced by mot1–24. mot1–24 alone had no effect on the DNase I digestion pattern (not shown). (D) The rate of dissociation of the TBPc–mot1–24–DNA complex in the presence of 25 μM ATP. The progress curve is biphasic and characterized by half-times of 0.23 (−0.17, +0.42) and 36.2 (−2.5, +3.1) min and amplitudes of 0.09 (−0.02, +0.03) and 0.91 (−0.03, +0.01), respectively. (E) Relative TBP-stimulated ATPase activity of wild-type Mot1, mot1–505, and mot1–24. ‘None', no Mot1 added. Average activity±standard deviation derived from two or more assays is shown. TBP (100 nM) was present in all reactions.
Figure 7
Upstream DNA is critical for Mot1's ATP-dependent dissociation activity. (A) A schematic representation of three DNA molecules possessing identical TATA and downstream DNA sequences, but different lengths of DNA upstream of the TATA Box. The length of each upstream strand is indicated in nucleotides. (B, C) The TATA Box occupancy as assayed by DNase I footprinting of TBPc and TBP, respectively, on the three DNA templates. The concentrations of TBPc, TBP, Mot1, and ATP used were 8 nM, 12 nM, 8 nM, and 25 μM, respectively. ATP was added for 1 or 5 min as indicated. Representative autoradiograms for this experiment are shown in Supplementary Figure S3. (D) Rate of dissociation of the Mot1–TBPc–DNA ternary complex in the presence of ATP. The dissociation reaction is well described by a single exponential with a half-time of 9.5 (−1.1, +1.3) min. (E) Rate of dissociation of the Mot1–TBPc–DNA ternary complex in the absence of ATP. The curve is biphasic and is characterized by half-times of 3.8 (−1.5, +2.4) and 50.7 (−10.1, +12.4) min.
Figure 8
Site-specific photocrosslinking of Mot1 to DNA. (A) DNA probes used. The native, unsubstituted sequence is shown. Asterisks indicate positions of 5-IdU substitution. (B) Radiolabeled DNAs (∼0.5 nM) were incubated with 8 nM TBPc±8 nM Mot1 and irradiated as indicated. Mot1 was added to all three reactions with unsubstituted DNA (‘no 5-IdU') and as indicated for the others. Reactions were irradiated and products resolved on a 10% protein gel; crosslinked products were visualized by PhosphorImager analysis. There was no detectable crosslinking of Mot1 to probe nos. 2 and 5 (not shown). (C) Reactions were performed as in (B) with 312 nm UV light and the components as indicated. (D) Reactions were performed as in (B) with 312 nm UV irradiation for the times indicated. All reactions contained Mot1. In panels (B–D), arrow indicates the Mot1–DNA crosslinked product.
Figure 9
The effect on DNA binding of the order of Mot1 addition to TBP or TBPc was assayed by DNase I footprinting by combining the components in the order indicated in (A). The differences in the apparent saturation of TBP and TBPc seen in (B) reflect their different binding affinities (data not shown). The reactions contained 8.8 nM TBPc without (1) or with (2) 19.2 nM Mot1 or 15 nM TBP without (1) or with (2) 23 nM Mot1. Radiolabeled TATA-containing DNA was then added to each reaction for 5, 10, or 15 min prior to sampling the occupancy of the TATA Box with DNase 1. Quantitation of TATA binding is shown in the bar graph. See Supplementary Figure S4 for a representative autoradiogram.
Figure 10
mot1–508 forms unstable ternary complexes and is defective for TBPc–DNA dissociation. (A) DNase I footprinting experiment in which wild-type Mot1 (9 nM, lane 3) or varying concentrations of mot1–508 were added to preformed TBPc–DNA complexes for 2 min prior to DNase I digestion. Reactions in lanes 4–10 contained 0.5, 1.2, 2, 4, 8, 12, or 16 nM mot1–508, respectively. TBPc concentration was 8.8 nM. Arrow indicates upstream protection due to wild-type Mot1 but not mot1–508. (B) Electrophoretic mobility shift assay using radiolabeled DNA, 10 nM TBP, 25 μM ATP, and wild-type Mot1 or mot1–508 at the indicated concentrations. TBP and DNA were incubated together for 20 min followed by the addition of Mot1±ATP as indicated for 25 min prior to loading on the gel. Positions of the free DNA, TBP–DNA, and Mot1–TBP–DNA complexes are indicated. (C) The rate of dissociation of TBPc–mot1–508–DNA complexes in the presence of 25 μM ATP. The progress curve is adequately fit by a single exponential decay with a half-time of 6.17 min (−0.5, +0.55). (D) mot1–508 supports yeast cell viability. A MOT1 shuffling strain (Darst et al, 2003) was transformed with plasmid-borne wild-type MOT1, mot1–508, or vector alone. Strains were spotted onto synthetic media containing 5-fluoroorotic acid in 10-fold serial dilutions. (E) mot1–508 possesses wild-type ATPase activity. The bar graph shows relative ATPase activity in the absence (white bars) or presence (gray bars) of 100 nM TBP. ‘None' refers to the ATPase activity of TBP without added Mot1.
Figure 11
mot1–509 forms unstable ternary complexes and exhibits reduced TBP-stimulated ATPase activity. (A) Electrophoretic mobility shift assay performed as in Figure 10B, but with mot1–509 at the indicated concentrations. (B) The rate of dissocation of TBPc–mot1–509–DNA complexes in the presence of 25 μM ATP. The curve is a single exponential characterized by a half-time of 9.6±0.95 min. (C) A MOT1 shuffling strain was transformed with plasmid-borne copies of wild-type MOT1, mot1–509, or vector alone. In the left panel, the indicated MOT1 alleles were under the control of the MOT1 promoter. In the right-hand panel, the indicated alleles were under the control of the GAL1 promoter. Strains were spotted in 10-fold serial dilutions on synthetic media containing either glucose (SC; left panel) or galactose (SG; right panel). (D) The bar graph shows relative ATPase activity of mot1–509 compared to wild-type Mot1 in the absence (white bars) or presence (gray bars) of 100 nM TBP.
Similar articles
- Mot1 regulates the DNA binding activity of free TATA-binding protein in an ATP-dependent manner.
Darst RP, Dasgupta A, Zhu C, Hsu JY, Vroom A, Muldrow T, Auble DT. Darst RP, et al. J Biol Chem. 2003 Apr 11;278(15):13216-26. doi: 10.1074/jbc.M211445200. Epub 2003 Feb 4. J Biol Chem. 2003. PMID: 12571241 - Two-step mechanism for modifier of transcription 1 (Mot1) enzyme-catalyzed displacement of TATA-binding protein (TBP) from DNA.
Moyle-Heyrman G, Viswanathan R, Widom J, Auble DT. Moyle-Heyrman G, et al. J Biol Chem. 2012 Mar 16;287(12):9002-12. doi: 10.1074/jbc.M111.333484. Epub 2012 Feb 1. J Biol Chem. 2012. PMID: 22298788 Free PMC article. - Function and structural organization of Mot1 bound to a natural target promoter.
Sprouse RO, Shcherbakova I, Cheng H, Jamison E, Brenowitz M, Auble DT. Sprouse RO, et al. J Biol Chem. 2008 Sep 5;283(36):24935-48. doi: 10.1074/jbc.M803749200. Epub 2008 Jul 7. J Biol Chem. 2008. PMID: 18606810 Free PMC article. - One small step for Mot1; one giant leap for other Swi2/Snf2 enzymes?
Viswanathan R, Auble DT. Viswanathan R, et al. Biochim Biophys Acta. 2011 Sep;1809(9):488-96. doi: 10.1016/j.bbagrm.2011.05.012. Epub 2011 May 30. Biochim Biophys Acta. 2011. PMID: 21658482 Free PMC article. Review. - Snf2 family ATPases and DExx box helicases: differences and unifying concepts from high-resolution crystal structures.
Dürr H, Flaus A, Owen-Hughes T, Hopfner KP. Dürr H, et al. Nucleic Acids Res. 2006;34(15):4160-7. doi: 10.1093/nar/gkl540. Epub 2006 Aug 25. Nucleic Acids Res. 2006. PMID: 16935875 Free PMC article. Review.
Cited by
- ATR phosphorylates SMARCAL1 to prevent replication fork collapse.
Couch FB, Bansbach CE, Driscoll R, Luzwick JW, Glick GG, Bétous R, Carroll CM, Jung SY, Qin J, Cimprich KA, Cortez D. Couch FB, et al. Genes Dev. 2013 Jul 15;27(14):1610-23. doi: 10.1101/gad.214080.113. Genes Dev. 2013. PMID: 23873943 Free PMC article. - Swi2/Snf2 remodelers: hybrid views on hybrid molecular machines.
Hopfner KP, Gerhold CB, Lakomek K, Wollmann P. Hopfner KP, et al. Curr Opin Struct Biol. 2012 Apr;22(2):225-33. doi: 10.1016/j.sbi.2012.02.007. Epub 2012 Mar 23. Curr Opin Struct Biol. 2012. PMID: 22445226 Free PMC article. Review. - CryoEM structures of Arabidopsis DDR complexes involved in RNA-directed DNA methylation.
Wongpalee SP, Liu S, Gallego-Bartolomé J, Leitner A, Aebersold R, Liu W, Yen L, Nohales MA, Kuo PH, Vashisht AA, Wohlschlegel JA, Feng S, Kay SA, Zhou ZH, Jacobsen SE. Wongpalee SP, et al. Nat Commun. 2019 Sep 2;10(1):3916. doi: 10.1038/s41467-019-11759-9. Nat Commun. 2019. PMID: 31477705 Free PMC article. - The RSC chromatin remodelling ATPase translocates DNA with high force and small step size.
Sirinakis G, Clapier CR, Gao Y, Viswanathan R, Cairns BR, Zhang Y. Sirinakis G, et al. EMBO J. 2011 May 6;30(12):2364-72. doi: 10.1038/emboj.2011.141. EMBO J. 2011. PMID: 21552204 Free PMC article. - Coordinated protein and DNA remodeling by human HLTF on stalled replication fork.
Achar YJ, Balogh D, Haracska L. Achar YJ, et al. Proc Natl Acad Sci U S A. 2011 Aug 23;108(34):14073-8. doi: 10.1073/pnas.1101951108. Epub 2011 Jul 27. Proc Natl Acad Sci U S A. 2011. PMID: 21795603 Free PMC article.
References
- Ackers GK, Shea MA, Smith FR (1983) Free energy coupling within macromolecules. The chemical work of ligand binding at individual sites in co-operative systems. J Mol Biol 170: 223–242 - PubMed
- Adamkewicz JI, Hansen KE, Prud'homme WA, Davis JL, Thorner J (2001) High-affinity interaction of yeast transcriptional regulator, Mot1, with TATA Box-binding protein (TBP). J Biol Chem 276: 11883–11984 - PubMed
- Adamkewicz JI, Mueller CGF, Hansen KE, Prud'homme WA, Thorner J (2000) Purification and enzymic properties of Mot1 ATPase, a regulator of basal transcription in the yeast Saccharomyces cerevisiae. J Biol Chem 275: 21158–21168 - PubMed
- Auble DT, Hahn S (1993) An ATP-dependent inhibitor of TBP binding to DNA. Genes Dev 7: 844–856 - PubMed
Publication types
MeSH terms
Substances
LinkOut - more resources
Full Text Sources
Molecular Biology Databases


