Using pyrosequencing to shed light on deep mine microbial ecology - PubMed (original) (raw)
Using pyrosequencing to shed light on deep mine microbial ecology
Robert A Edwards et al. BMC Genomics. 2006.
Abstract
Background: Contrasting biological, chemical and hydrogeological analyses highlights the fundamental processes that shape different environments. Generating and interpreting the biological sequence data was a costly and time-consuming process in defining an environment. Here we have used pyrosequencing, a rapid and relatively inexpensive sequencing technology, to generate environmental genome sequences from two sites in the Soudan Mine, Minnesota, USA. These sites were adjacent to each other, but differed significantly in chemistry and hydrogeology.
Results: Comparisons of the microbes and the subsystems identified in the two samples highlighted important differences in metabolic potential in each environment. The microbes were performing distinct biochemistry on the available substrates, and subsystems such as carbon utilization, iron acquisition mechanisms, nitrogen assimilation, and respiratory pathways separated the two communities. Although the correlation between much of the microbial metabolism occurring and the geochemical conditions from which the samples were isolated could be explained, the reason for the presence of many pathways in these environments remains to be determined. Despite being physically close, these two communities were markedly different from each other. In addition, the communities were also completely different from other microbial communities sequenced to date.
Conclusion: We anticipate that pyrosequencing will be widely used to sequence environmental samples because of the speed, cost, and technical advantages. Furthermore, subsystem comparisons rapidly identify the important metabolisms employed by the microbes in different environments.
Figures
Figure 1
Sampling from the Soudan Mine. The Soudan Mine is an Algoma-type Iron Formation rich in hematite. Panel A shows a cross-section of the mine looking East-North-East at 78.5°. Panel B depicts a three dimensional view of the mine, including the cross-section shown in Panel A, and with the sampling sites shown for the "Red" and "Black" samples. Panel C shows the overall flow of water in the mine at level 27, located 714 meters below the surface (Panel D). Panels E and F show a close up of the two sampling sites.
Figure 2
Composition of the 16S rDNA sequences from the two samples and comparison of 16S sequences from the 454 libraries and a traditional clone library. The percentage of all sequences from each library in each of the orders is shown for the 454-sequenced Black sample (solid black bars; n = 24), the 454 sequenced red sample (solid red bars; n = 76), and the PCR amplified clone library (hatched red bars; n = 91).
Figure 3
Subsystems in the Red and Black Samples. The occurrence of classes of subsystems is shown as a percent of all subsystems in each sample for the Red and Black samples. Notes and abbreviations: The subsystem class "Glu, Asp" also contains Gln and Asn. The subsystem class "Lys, Thr" also contains Met and Cys. CHO: Carbohydrates; sacch: saccharides; Extracell. Poly: Extracellular polysaccharides; Myco: Mycobacterial cell wall; Gm: Gram stain positive (+) or negative (-); Clust: clusters; RFN: Riboflavin; T: Transporters; Mot: Motility; N: Nitrogen; Resp: Respiration; e-: electron; S: Sulfur.
Figure 5
Cations and Anions found in the Soudan Mine. The pie chart shows the abundance of cations and anions found in the mine. The numbers in parentheses are the concentrations (in ppm) of each ion in the "Black" and "Red" samples respectively. The minor ions are shown expanded in the rightmost pie.
Figure 6
Respiration in aerobic and anaerobic environments. Among other potential pathways in the Soudan mine, electrons are transferred from hydrogenases to either cytochromes and then to oxygen to produce water in an oxidative environment, or via nitrate and nitrite reductases (denitrification) in anaerobic environments. Genes encoding the hydrogenases, respiratory complexes, and terminal cytochromes of the aerobic sample were significantly more abundant in the Red (oxidized) sample, while genes encoding the hydrogenases and denitrification genes were more abundant in the Black (reduced) sample. After Vassieva, O. [25]
Figure 4
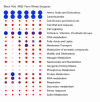
Subsystems present in different metagenome sequences. The subsystems present in the Soudan samples, the Iron Mountain AMD sample, the Minnesota Farm and the Sargasso Sea are shown grouped by family. The red x corresponds to very low abundance or complete absence of that family of subsystems. The size of the circle represents the proportion of sequences seen within that family of subsystems.
References
Publication types
MeSH terms
Substances
LinkOut - more resources
Full Text Sources
Other Literature Sources
Molecular Biology Databases


