Control of daily transcript oscillations in Drosophila by light and the circadian clock - PubMed (original) (raw)
Control of daily transcript oscillations in Drosophila by light and the circadian clock
Herman Wijnen et al. PLoS Genet. 2006 Mar.
Abstract
The transcriptional circuits of circadian clocks control physiological and behavioral rhythms. Light may affect such overt rhythms in two ways: (1) by entraining the clock circuits and (2) via clock-independent molecular pathways. In this study we examine the relationship between autonomous transcript oscillations and light-driven transcript responses. Transcript profiles of wild-type and arrhythmic mutant Drosophila were recorded both in the presence of an environmental photocycle and in constant darkness. Systematic autonomous oscillations in the 12- to 48-h period range were detectable only in wild-type flies and occurred preferentially at the circadian period length. However, an extensive program of light-driven expression was confirmed in arrhythmic mutant flies. Many light-responsive transcripts are preferentially expressed in the compound eyes and the phospholipase C component of phototransduction, NORPA (no receptor potential), is required for their light-dependent regulation. Although there is evidence for the existence of multiple molecular clock circuits in cyanobacteria, protists, plants, and fungi, Drosophila appears to possess only one such system. The sustained photic expression responses identified here are partially coupled to the circadian clock and may reflect a mechanism for flies to modulate functions such as visual sensitivity and synaptic transmission in response to seasonal changes in photoperiod.
Conflict of interest statement
Competing interests. The authors have declared that no competing interests exist.
Figures
Figure 1. Strategy for Detecting Intrinsic Expression Rhythms
(1) Expression values are calculated from raw data using the RMA signal algorithm. Data for each time-course experiment are mean-centered and standardized. (2) Next, 1,000 permuted datasets are derived by randomizing the order of time points within experiments. (3) Both the real and permuted data are subjected to Fourier analysis to determine of the strength of periodic expression components. (4) Finally, the distribution of periodic expression components in the real data and the permuted data are compared and illustrated by QQ plots.
Figure 2. Genome-Wide Detection of Rhythmicity in Wild-Type LD/DD Time Series
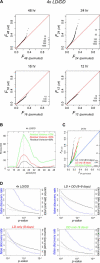
(A) QQ plots of spectral power (squared Fourier components) at four different periods are shown for microarray data collected from four wild-type 2-d LD/DD time course experiments. Upward deviations from the diagonals indicate global enrichment in time traces with that periodicity, while downward deviations indicate depletion. The ticks on the right show the number of profiles that exceed a certain Fourier value, emphasizing that the enrichments at 24 and 48 h are tail effects that affect no more than approximately 5% of the genome. Fourier components with 16 and 12-h periods do not show similar deviations. (B) Strongest oscillations in the 4x LD/DD wild-type data occur for periods near 24 h. The data were fitted with cosines, and then sets of transcript profiles were chosen based on how much of their variance was due to the cosine fit. Invariably, fitting the data with 24-h period cosines produced the largest sets (as indicated by the vertical axis). Each of the three curves is the same analysis done at different levels of fit stringency, with the black curve (“Residual Variance < 50%”) being the most stringent selection. (C) The contours of an extensive circadian expression program emerge from a comprehensive meta-analysis. The QQ plots (same format as for panel [A]) represent the 24-h spectral power distribution across all available wild-type LD and DD time-course data (this study; [–18]; eight and nine independent days for, respectively, LD and DD). Analyses for LD data, DD data, and the combined LD + DD set are shown separately. (D) Reliable detection of extensive daily expression programs. The diagrams show the FDR (blue line), as well as the raw and background-corrected numbers of daily transcript oscillations (total and net counts; solid and dashed black lines) as a function of the selective _p_-value cut-off that is applied (see Materials and Methods). Compared to the original 4× LD/DD data analysis (upper left panel) integrative analysis of the expanded LD + DD (8 + 9 d) dataset (upper right panel) is clearly more powerful. Note that the relative enrichment of 24-h periodic patterns is enhanced in the combined LD + DD data (upper right panel) set relative to the LD-only and DD-only subsets (lower left and right panels), and that substantially more daily oscillations are detected in LD versus DD conditions.
Figure 3. Comparison of 24-h Oscillations between Wild-Type and tim01 Genotypes
(A) Direct comparison between value-ordered wild-type and tim01 24-h Fourier scores. The upward trend represents a clock-dependent enrichment in high-quality circadian oscillations. The same format is used here as for Figure 2A except that the tim01 Fourier scores take the place of the permutation background model. To compare equal numbers of days in both genotypes, four days of data (2× LD/DD) are used on each axis. (B and C) QQ plots comparing the data in panel (A) to a permutation null model (method as in Figure 2A). (B) Comparison of wild-type data to the permutation null model shows that the enrichment in Fig. 2A persists (although somewhat damped) with half the amount of data (2xLD/DD). (C) Comparison of tim01 data (2× LD/DD) to the permutation null model shows that 24-h oscillations, if present, are not obviously enriched in the absence of a working circadian clock.
Figure 4. Northern Analyses Confirm the Absence of Circadian Transcript Profiles from tim01 Fly Heads
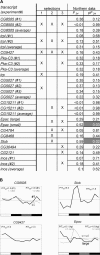
(A) LD/DD time-course Northern blots were performed in tim01 flies for the 14 genes listed in column 1, which were sampled from three selections of candidates with the highest probability of showing circadian oscillations in the tim01 flies. Selection 1 represents a top-down ranking of the 30 best circadian oscillators for the tim01 microarray data as predicted by Fourier analysis. Selection 2 uses the same criterion, but only includes transcripts with a predicted circadian oscillation in wild-type flies. Selection 3 refers to a top-down ranking of the 30 best circadian oscillators for a combined dataset containing an equal number of tim01 and wild-type microarrays. The criteria for Selection 3, but not Selection 2, require that the predicted circadian oscillations for tim01 and wild-type be in the same phase. An X in columns 2–4 indicates which selection(s) each gene is a member of. The 24-h Fourier scores and associated probabilities (pF24) observed in the Northern profiles are given in columns 5 and 6. Three independent hybridizations were performed for CG5027 and two were performed for CG8505, trpl, Pka-C3, and Inos. In these cases, the statistics for the average profile were also determined. The two distinct transcripts (“small” and “large”) that were observed on Northern blots for Epac were analyzed separately. pF24 values of ≤ 0.05 are indicated by white script in shaded boxes. Only the pF24 and F24 scores for Slob and the smaller transcript of Epac indicate daily oscillations in tim01. All other transcripts showed non-oscillatory expression patterns with high pF24 scores. (B) Further investigation revealed that Slob and Epac show light-regulated rather than circadian responses. Graphed Northern data for five of the fifteen transcripts (CG8505, Slob, and CG9427, and two transcripts, indicated as “small” and “large” for Epac). Peak to trough expression ratios for the LD and DD parts of the time courses are indicated as P/T. The complete graphed Northern data are available in Figure S1.
Figure 5. Separate and Combined Effects of Light and the Circadian Clock on Daily Expression Profiles
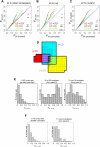
(A) QQ plot (same format as Figures 2 and 3), showing direct wild-type to mutant comparisons of the 24-h spectral power distributions for time-course data obtained in LD conditions (4× 1 d), DD conditions (4× 1 d), or the combined LD and DD datasets. (B and C) The arrhythmic mutant datasets consist of equal amounts tim01 and per0 data. QQ plots that separately compare the wild-type and mutant 24-h spectral power distributions to permuted background models are shown. Clock-independent light-driven effects are responsible for the enrichment in oscillatory profiles in mutant LD (red) versus DD (green) data (C), whereas light-independent circadian effects are represented by the difference between wild-type and mutant DD (green) spectral power distributions (A) and compare (B) with (C). The enhanced difference between the combined LD + DD datasets (black) for wild-type and mutant, visualized by the deviation from the diagonal in (A), indicates the alignment of LD and DD rhythmic profiles that occurs as a result of clock-dependent regulation. (D) Circadian and light-driven regulation is indicated by overlap among the top-ranking oscillators in wild-type LD, wild-type DD, and mutant LD. The diagrammed selections of 77 wild-type LD profiles, 31 wild-type DD profiles, and 71 mutant LD profiles were obtained by demanding a high 24-h spectral power (p ≤ 4.5 × 10⁻⁴ [approximately F24 > 0.6]) and applying two noise filters (more than half of the values above the 20th percentile and absolute range > 0.5). No mutant DD profiles were found that passed these selection criteria. Circadian regulation is indicated by the significant overlap between the wild-type LD and wild-type DD selections (Fisher's exact test p < 10−26), whereas light-dependent regulation is represented by the significant overlap between the wild-type and mutant LD selections (Fisher's exact test _p_ < 10−19). The plus signs (+) correspond to transcript profiles that rank among the best oscillators in the wild-type LD + DD dataset (_p_ ≤ 10−4; more than half of the values above the 20th percentile; absolute range > 0.5). (E) Wild-type LD spectral power scores are dramatically increased among wild-type DD oscillators and mutant LD oscillators. Histograms of the wild-type LD 24-h spectral power are shown from left to right: for all transcripts exceeding a noise filter (11,197 with more than half of the values above the 20th percentile), and for the selections of 31 wild-type DD oscillators and 71 mutant LD oscillators from panel (D). Mann-Whitney rank sum tests confirm that these differences are highly significant (p < 10−13 for 31 wild-type DD oscillators versus rest; p < 10−24 for 71 mutant LD oscillators versus rest). (F) Wild-type DD spectral power scores are elevated among mutant LD oscillators. Histograms of the wild-type DD 24-h spectral power are shown on the left for all transcripts exceeding a noise filter (11,197 with more than half of the values above the 20th percentile) and on the right for the selection of 71 mutant LD oscillators from panel (D). A Mann-Whitney rank-sum test confirms the significance of this difference (p < 10−4).
Figure 6. Transcripts with a Sustained Photoresponse
A selection of 20 light-driven transcripts emerges from statistical analysis of wild-type and tim01 microarray expression data (see Materials and Methods). Pairwise hierarchical clustering of the expression profiles for this selection indicates a grouping of nine light-induced transcripts and a grouping of 11 light-repressed transcripts. Columns correspond to experimental time points, rows correspond to genes. Colors in the order cyan to light gray to magenta represent normalized RMA values of increasing strength, with light gray corresponding to the time-course average. The blocked horizontal bars below the cluster diagrams illustrate the environmental light/dark schedule used in the time courses, with white indicating light, black indicating darkness, and gray indicating subjective light under free-running conditions of constant darkness. The first 48 columns in the cluster diagrams represent the RMA expression values normalized per experiment and ordered by experimental time for four wild-type time courses, whereas the last 24 columns represent the two tim01 time-course experiments in the same format. The trees on the left of the cluster diagrams show the pairwise similarity relationships between the clustered transcript profiles. Note the almost purely light-driven patterns in tim01 flies and the more complex patterns observed in a wild-type context where there is often also a circadian expression component present.
Figure 7. Expression Analysis of Light-Regulated Transcripts
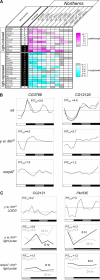
(A) Northern analyses confirm light-driven regulation for 25 transcripts. This regulation persists for most transcripts in the context of circadian clock mutants (tim01, per0, and Clkjrk) or the circadian photoreception mutant cryb, but it is disrupted by mutation of the norpA gene. Light-regulated transcripts were identified based on statistical analysis of microarray data. For completeness, the group of 20 from Figure 6 is supplemented here with seven additional light-regulated transcripts (CG15211, CG2082, CG3799, Pka-C3, alpha-Man-IIb, Pkc53E, and CdsA) that emerged from our selection protocol when an alternative microarray signal algorithm was used (MAS 4.0 instead of RMA). Rows corresponding to individual transcripts (column 1) are ordered based on the peak expression phase (in 1-h intervals of ZT, relative to ZT0 = lights-on), estimated by 24-h spectral analysis of wild-type LD microarray profiles (column 2). As a result, the light-induced transcripts (rows 1–11) are separated from the light-repressed transcripts (rows 12–27). Northern analysis results are summarized for 2-d LD/DD time-course experiments with wild-type, tim01, per0, Clkjrk, cryb, or norpA mutant flies (columns 3, 4, and 7–10) and 1-d time-courses describing 6-h or 24-h light-pulse treatments of dark-raised tim01 or norpA7; tim01 flies (columns 5, 6, 11, and 12). The peak/trough ratios for light-induced genes and trough/peak ratios for light-repressed genes that were observed during the LD portion of LD/DD time courses (columns 3–4 and 7–10) or the 1-d light pulse experiments (columns 5–6 and 11–12) are color-coded as indicated, with light-induction and repression represented by increasingly intense shades of magenta and cyan, respectively. Gray rectangles represent patterns with peak/trough ratios below 1.4 or trough/peak ratios above 0.71, and gray rectangles with white crosses correspond to other patterns inconsistent with light-driven regulation. Combined analysis of Northern and microarray DD time-course data indicated exceptionally strong circadian regulation (F24 p-value < 10−3; indicated as “C”) for four of the light-regulated transcripts (CG2121, CG5798, CG3799, and Slob; column 3), and this regulation persisted in a norpA mutant context for three of these (CG2121, CG5798, and CG3799; indicated as “C” in column 10). (B and C) Examples of the Northern data summarized in panel (A). Graphed Northern analyses for four light-regulated transcripts. In panel (B), wild-type, y w; tim01, and norpA7 graphed LD/DD time-course profiles are shown for two light-repressed transcripts, CG3799 and CG12120, whereas panel (C) represents light responses observed in a y w; tim01 LD/DD time course and in light-pulse treated y w; tim01 or norpA7; tim01 flies for one light-induced transcript (CG2121) and one light-repressed transcript (Pkc53E). After background subtraction, Northern signals for LD/DD time courses were normalized to a loading control and graphed relative to the normalized time-course average (indicated as a horizontal). One-day LD time courses (indicated by the shorter lines in the wild-type panels) are centered on the average expression ratio observed during the LD part of matching LD-DD experiments. The combined 6-h and 24-h light pulse profiles for y w; tim01 and norpA7; tim01 were normalized to the average of the ZT2 and the ZT6 time points that were taken during both light pulse treatments. Peak to trough expression ratios for the LD part of time courses or the 1-d light-pulse experiments are indicated as P/T. Each line represents the results from a separate blot. The complete graphed Northern data for light-driven transcripts is available in Figure S3.
Figure 8. Superposition of Photocycle and Circadian Expression Patterns Revealed by a Parametric Model
Normalized RMA expression ratios for the wild-type LD/DD time-course data are fitted to a model consisting of a cosine function representing circadian expression and a pulse function representing light-dependent regulation. During the LD conditions of the first 24 h, both functions contribute to the fit (as indicated by the dotted lines), but during the DD conditions of the second day, the model reverts to the cosine function. tim01 LD/DD expression ratios are fitted to a pulse-only model. Examples are shown for two standard circadian genes (vri and Ugt35b) and four light-regulated circadian genes (rgr, CG2121, CG5798, and Slob).
Similar articles
- Drosophila free-running rhythms require intercellular communication.
Peng Y, Stoleru D, Levine JD, Hall JC, Rosbash M. Peng Y, et al. PLoS Biol. 2003 Oct;1(1):E13. doi: 10.1371/journal.pbio.0000013. Epub 2003 Sep 15. PLoS Biol. 2003. PMID: 12975658 Free PMC article. - Temperature synchronization of the Drosophila circadian clock.
Glaser FT, Stanewsky R. Glaser FT, et al. Curr Biol. 2005 Aug 9;15(15):1352-63. doi: 10.1016/j.cub.2005.06.056. Curr Biol. 2005. PMID: 16085487 - Insect circadian clock outputs.
Helfrich-Förster C, Nitabach MN, Holmes TC. Helfrich-Förster C, et al. Essays Biochem. 2011 Jun 30;49(1):87-101. doi: 10.1042/bse0490087. Essays Biochem. 2011. PMID: 21819386 Review. - A one-day journey to the suburbs: circadian clock in the Drosophila visual system.
Damulewicz M, Mazzotta GM. Damulewicz M, et al. FEBS J. 2024 Nov 1. doi: 10.1111/febs.17317. Online ahead of print. FEBS J. 2024. PMID: 39484992 Review.
Cited by
- Thermoregulated transcriptomics: the molecular basis and biological significance of temperature-dependent alternative splicing.
Haltenhof T, Preußner M, Heyd F. Haltenhof T, et al. Biochem J. 2024 Aug 7;481(15):999-1013. doi: 10.1042/BCJ20230410. Biochem J. 2024. PMID: 39083035 Free PMC article. Review. - PDP1epsilon functions downstream of the circadian oscillator to mediate behavioral rhythms.
Benito J, Zheng H, Hardin PE. Benito J, et al. J Neurosci. 2007 Mar 7;27(10):2539-47. doi: 10.1523/JNEUROSCI.4870-06.2007. J Neurosci. 2007. PMID: 17344391 Free PMC article. - Natural alleles of the clock gene timeless differentially affect life-history traits in Drosophila.
Andreatta G, Montagnese S, Costa R. Andreatta G, et al. Front Physiol. 2023 Jan 10;13:1092951. doi: 10.3389/fphys.2022.1092951. eCollection 2022. Front Physiol. 2023. PMID: 36703932 Free PMC article. - Bayesian detection of non-sinusoidal periodic patterns in circadian expression data.
Chudova D, Ihler A, Lin KK, Andersen B, Smyth P. Chudova D, et al. Bioinformatics. 2009 Dec 1;25(23):3114-20. doi: 10.1093/bioinformatics/btp547. Epub 2009 Sep 22. Bioinformatics. 2009. PMID: 19773336 Free PMC article. - The circadian output gene takeout is regulated by Pdp1epsilon.
Benito J, Hoxha V, Lama C, Lazareva AA, Ferveur JF, Hardin PE, Dauwalder B. Benito J, et al. Proc Natl Acad Sci U S A. 2010 Feb 9;107(6):2544-9. doi: 10.1073/pnas.0906422107. Epub 2010 Jan 21. Proc Natl Acad Sci U S A. 2010. PMID: 20133786 Free PMC article.
References
- Dunlap JC, Loros JJ. The Neurospora circadian system. J Biol Rhythms. 2004;19:414–424. - PubMed
- Hall JC. Systems approaches to biological rhythms in Drosophila . Methods Enzymol. 2005;393:61–185. - PubMed
- Hardin PE. The circadian timekeeping system of Drosophila . Curr Biol. 2005;15:R714–722. - PubMed
- Hardin PE. Transcription regulation within the circadian clock: the E-box and beyond. J Biol Rhythms. 2004;19:348–360. - PubMed
- Harms E, Kivimae S, Young MW, Saez L. Posttranscriptional and posttranslational regulation of clock genes. J Biol Rhythms. 2004;19:361–373. - PubMed
Publication types
MeSH terms
Substances
Grants and funding
- F32 MH063579/MH/NIMH NIH HHS/United States
- R37 GM054339/GM/NIGMS NIH HHS/United States
- GM54339/GM/NIGMS NIH HHS/United States
- MH63579/MH/NIMH NIH HHS/United States
- R01 GM054339/GM/NIGMS NIH HHS/United States
- F32 MH063579-03/MH/NIMH NIH HHS/United States
LinkOut - more resources
Full Text Sources
Molecular Biology Databases


