Loss of SOCS3 in T helper cells resulted in reduced immune responses and hyperproduction of interleukin 10 and transforming growth factor-beta 1 - PubMed (original) (raw)
Loss of SOCS3 in T helper cells resulted in reduced immune responses and hyperproduction of interleukin 10 and transforming growth factor-beta 1
Ichiko Kinjyo et al. J Exp Med. 2006.
Abstract
Suppressor of cytokine signaling (SOCS)3 is a major negative feedback regulator of signal transducer and activator of transcription (STAT)3-activating cytokines. Transgenic mouse studies indicate that high levels of SOCS3 in T cells result in type 2 T helper cell (Th2) skewing and lead to hypersensitivity to allergic diseases. To define the physiological roles of SOCS3 in T cells, we generated T cell-specific SOCS3 conditional knockout mice. We found that the mice lacking SOCS3 in T cells showed reduced immune responses not only to ovalbumin-induced airway hyperresponsiveness but also to Leishmania major infection. In vitro, SOCS3-deficient CD4+ T cells produced more transforming growth factor (TGF)-beta1 and interleukin (IL)-10, but less IL-4 than control T cells, suggesting preferential Th3-like differentiation. We found that STAT3 positively regulates TGF-beta1 promoter activity depending on the potential STAT3 binding sites. Furthermore, chromatin immunoprecipitation assay revealed that more STAT3 was recruited to the TGF-beta1 promoter in SOCS3-deficient T cells than in control T cells. The activated STAT3 enhanced TGF-beta1 and IL-10 expression in T cells, whereas the dominant-negative form of STAT3 suppressed these. From these findings, we propose that SOCS3 regulates the production of the immunoregulatory cytokines TGF-beta1 and IL-10 through modulating STAT3 activation.
Figures
Figure 1.
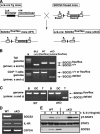
Generation of T cell–specific SOCS3-deficient mice. (A) Schema of SOCS3 floxed and deleted loci. Exon 2 was flanked by two LoxP sites (arrowheads). (B) PCR genotyping of floxed alleles using the primer set of a and b against tail genome and deleted alleles using the primer set of a and c against genomic DNA of CD4+ T cells from indicated mice. (C) PCR detection of undeleted and deleted floxed alleles using primer set a and c against genomic DNA from B cells, DCs, and CD4+ T cells. (D) RT-PCR analysis for mRNA expression of SOCS3, IL-6R, and glyceraldehydes-3-phoshate dehydrogenase (G3PDH) in IL-6–stimulated MACS purified splenic CD4+ T cells from cKO and WT mice. (E) Western blotting analysis for SOCS3 and phosphorylated STAT3 in splenic CD4+ T cells.
Figure 2.
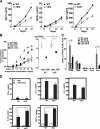
Reduced Th2 responses of SOCS3-deficient T cells in OVA/alum immunized mice. (A) Analyses of serum OVA-specific IgG1, IgG2a, and IgE titers in cKO and WT mice. Plasma samples were taken from mice (n = 5) at indicated days after immunization with OVA/alum on days 0 and 14. Ab titers were measured by ELISA and endpoint analysis. Data indicate mean ± SD. (B) Mice (n = 9 for each group) immunized with OVA/alum were aerosol challenged with OVA. Airway responsiveness was determined by the acetylcholine-dependent change in airway pressure in saline-treated control and OVA-sensitized/challenged WT and SOCS3-cKO mice. Provocative concentration 200 (PC200), the concentration at which airway pressure is 200% of its baseline value. Data indicate mean ± SD. (C) Cell counts in bronchoalveolar lavage fluid. *, P < 0.05 by analysis of variance with Bonferroni correction. Data indicate mean ± SD. (D) Cytokine profiles of Th1 type (IFN-γ), Th2 type (IL-4 and IL-5), and TGF-β1 and IL-10. Splenic CD4+ T cells isolated from OVA-immunized mice were restimulated with or without OVA ex vivo for 48 h. Cytokine levels were determined by ELISA. Data indicate mean ± SD in one representative experiment with five mice per group out of three independent experiments.
Figure 3.
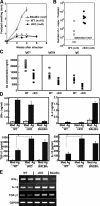
Reduced Th1 responses of SOCS3-deficient T cells in L. major infection. (A) Footpad swelling after L. major infection. BALB/c (a susceptible strain), WT, and SOCS3-cKO mice were inoculated in the right hind footpad with L. major promastigotes and the size of the footpad lesion was monitored. Data shown are mean ± SD and are representative of three independent experiments. BALB/c mice were killed at 4 wk for ethical reasons. (B) The number of parasites remaining in the footpads 6 wk after infection. (C) Serum IgG1, IgG2a, and IgE levels against L. major antigen in infected mice. Samples were collected from WT (open squares) and cKO (closed squares) mice 4 wk after infection. Total IgG1, IgG2a, and IgE titers were determined by ELISA. (D) Cytokine production by CD4+ T cells of the right popliteal LN from WT and cKO mice 4 wk after L. major infection. CD4+ T cells were cultured with irradiated naive WT splenocytes with (black bar) or without (gray bar) L. major antigen for 70 h. Concentrations of IFN-γ, IL-4, IL-10, and TGF-β1 in the culture supernatant were measured by ELISA. Data indicate mean ± SD of triplicate samples from five mice per group in one representative experiment out of three independent experiments. (*, P < 0.01). (E) IFN-γ, IL-10, and TGF-β1 mRNA levels determined by RT-PCR using total RNA from CD4+ right popliteal LN 4 wk after L. major infection.
Figure 4.
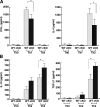
Cytokine production from in vitro–differentiated CD4+ T cells. IFN-γ and IL-4 production from in vitro–differentiated Th0/Th1/Th2 cells (A), and IL-10 and TGF-β1 production from Th0/Th2/Th3 cells (B). Naive CD4+ T cells were cultured under various differentiation conditions for 7 d as described in Materials and methods. After restimulation with anti-CD3ɛ mAb and anti-CD28 mAb for 24 h for IFN-γ, and with IL-4 and IL-10 for 72 h for TGF-β1, culture supernatants were collected and analyzed by ELISA. Data indicate mean ± SD of triplicate cultures in one representative experiment out of three independent experiments. *, P < 0.01.
Figure 5.
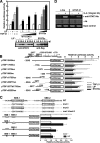
STAT3 directly enhances TGF-β1 promoter activity. (A) HEK293 cells were transfected with 0.2 μg of pTGF4.1-luc, a reporter gene containing ∼4.1 kb TGF-β1 promoter region, and 0.1 μg of β-galactosidase expression vector (β-gal) together with 0, 0.2, 0.6 μg WT-STAT3 or STAT3c expression vector. 1 d after transfection, cells were stimulated with 10 ng/ml LIF or 10 ng/ml TGF-β1 and luciferase activity was measured after 8 h. Luciferase activities were normalized by β-gal activities and expressed as fold induction to control cultures defined as 1.0. STAT3 expression levels determined by Western blotting analysis as shown (bottom). (B) Localization of the STAT3 responsive elements in the TGF-β1 promoter. HEK293 cells were transiently transfected with 0.2 μg of plasmid containing various fragments of TGF-β1 promoter region and 0.1 μg of β-gal expression vector. 1 d after transfection, cells were stimulated with 10 ng/ml LIF or 10 ng/ml TGF-β1 for 8 h and harvested. (C) Effects of point mutations introduced into the SBE-1 and SBE-2 elements. HEK293 cells were transiently transfected with WT or mutant pTGF4.1-luc plasmids and β-gal plasmid. Cells were stimulated with 10 ng/ml LIF and luciferase activities were measured. Luciferase activities were normalized by β-gal activities and expressed as fold induction to control cultures defined as 1.0. (D) ChIP assay was performed using chromatin from WT CD4+ T cells treated with IL-6 for 3 h and immunoprecipitated with antibody against STAT3. The final DNA extractions were amplified using pairs of primers that cover the STAT3 binding site (SBE-1) in the TGF-β1 or c-fos promoter region. G3PDH levels were determined by PCR using samples before immunoprecipitation as input control. Luciferase activities normalized by β-gal activity are shown as the means ± SD of three to five experiments.
Figure 6.
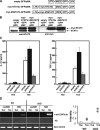
Retroviral transduction of STAT3 mutants modulates TGF-β1 and IL-10 production. (A) Schematic structure of the retroviral pMX vectors containing mutant STAT3, either myc-STAT3c (constitutive active form) or myc-dNSTAT3 (dominant negative form). (B) GFP-positive cells were sorted from infected T cells and the expression levels of exogeneous myc-STAT3 were examined by Western blotting. (C) IL-10 and TGFβ1 production from infected CD4+ T cells after Th3 differentiation. GFP-positive cells were cultured in the presence of IL-4, IL-10, and TGF-β1 for 7 d and restimulated with anti-CD3ɛ mAb and anti-CD28 mAb and cytokines in the culture supernatants were measured by ELISA. Data shown are mean ± SD of triplicate samples from four independent experiments. (D) ChIP assay to compare STAT3 recruitment to TGF-β1 promoter (SBE-1 site) between Th0 and Th3 differentiated T cells from WT and cKO mice. Anti-STAT3 Ab immunoprecipitates were used as templates for PCR cells. A non-SBE region near the transcription initiation sites was amplified as a negative control. Ratios of the bands intensity of SBE-1 PCR products and those of control (G3PDH) in two independent experiments are plotted (right).
Similar articles
- TGF-beta promotes Th17 cell development through inhibition of SOCS3.
Qin H, Wang L, Feng T, Elson CO, Niyongere SA, Lee SJ, Reynolds SL, Weaver CT, Roarty K, Serra R, Benveniste EN, Cong Y. Qin H, et al. J Immunol. 2009 Jul 1;183(1):97-105. doi: 10.4049/jimmunol.0801986. Epub 2009 Jun 17. J Immunol. 2009. PMID: 19535626 Free PMC article. - Loss of SOCS3 in the liver promotes fibrosis by enhancing STAT3-mediated TGF-beta1 production.
Ogata H, Chinen T, Yoshida T, Kinjyo I, Takaesu G, Shiraishi H, Iida M, Kobayashi T, Yoshimura A. Ogata H, et al. Oncogene. 2006 Apr 20;25(17):2520-30. doi: 10.1038/sj.onc.1209281. Oncogene. 2006. PMID: 16474852 - Loss of suppressor of cytokine signaling 1 in helper T cells leads to defective Th17 differentiation by enhancing antagonistic effects of IFN-gamma on STAT3 and Smads.
Tanaka K, Ichiyama K, Hashimoto M, Yoshida H, Takimoto T, Takaesu G, Torisu T, Hanada T, Yasukawa H, Fukuyama S, Inoue H, Nakanishi Y, Kobayashi T, Yoshimura A. Tanaka K, et al. J Immunol. 2008 Mar 15;180(6):3746-56. doi: 10.4049/jimmunol.180.6.3746. J Immunol. 2008. PMID: 18322180 - SOCS3 and STAT3, major controllers of the outcome of infection with Mycobacterium tuberculosis.
Rottenberg ME, Carow B. Rottenberg ME, et al. Semin Immunol. 2014 Dec;26(6):518-32. doi: 10.1016/j.smim.2014.10.004. Epub 2014 Nov 1. Semin Immunol. 2014. PMID: 25458989 Review. - The roles of SOCS3 and STAT3 in bacterial infection and inflammatory diseases.
Gao Y, Zhao H, Wang P, Wang J, Zou L. Gao Y, et al. Scand J Immunol. 2018 Dec;88(6):e12727. doi: 10.1111/sji.12727. Scand J Immunol. 2018. PMID: 30341772 Review.
Cited by
- SOCS, Inflammation, and Autoimmunity.
Yoshimura A, Suzuki M, Sakaguchi R, Hanada T, Yasukawa H. Yoshimura A, et al. Front Immunol. 2012 Mar 12;3:20. doi: 10.3389/fimmu.2012.00020. eCollection 2012. Front Immunol. 2012. PMID: 22566904 Free PMC article. - Stat3 mediates myeloid cell-dependent tumor angiogenesis in mice.
Kujawski M, Kortylewski M, Lee H, Herrmann A, Kay H, Yu H. Kujawski M, et al. J Clin Invest. 2008 Oct;118(10):3367-77. doi: 10.1172/JCI35213. J Clin Invest. 2008. PMID: 18776941 Free PMC article. - IL-6 prevents Th2 cell polarization by promoting SOCS3-dependent suppression of IL-2 signaling.
Bachus H, McLaughlin E, Lewis C, Papillion AM, Benveniste EN, Hill DD, Rosenberg AF, Ballesteros-Tato A, León B. Bachus H, et al. Cell Mol Immunol. 2023 Jun;20(6):651-665. doi: 10.1038/s41423-023-01012-1. Epub 2023 Apr 12. Cell Mol Immunol. 2023. PMID: 37046042 Free PMC article. - CREPT/RPRD1B promotes tumorigenesis through STAT3-driven gene transcription in a p300-dependent manner.
Zhai W, Ye X, Wang Y, Feng Y, Wang Y, Lin Y, Ding L, Yang L, Wang X, Kuang Y, Fu X, Eugene Chin Y, Jia B, Zhu B, Ren F, Chang Z. Zhai W, et al. Br J Cancer. 2021 Apr;124(8):1437-1448. doi: 10.1038/s41416-021-01269-1. Epub 2021 Feb 3. Br J Cancer. 2021. PMID: 33531691 Free PMC article. - Targeting Tregs in Malignant Brain Cancer: Overcoming IDO.
Wainwright DA, Dey M, Chang A, Lesniak MS. Wainwright DA, et al. Front Immunol. 2013 May 15;4:116. doi: 10.3389/fimmu.2013.00116. eCollection 2013. Front Immunol. 2013. PMID: 23720663 Free PMC article.
References
- O'Shea, J.J., M. Gadina, and R.D. Schreiber. 2002. Cytokine signaling in 2002: new surprises in the Jak/Stat pathway. Cell. 109:S121–S131. - PubMed
- Alexander, W.S., and D.J. Hilton. 2004. The role of suppressors of cytokine signaling (SOCS) proteins in regulation of the immune response. Annu. Rev. Immunol. 22:503–529. - PubMed
- Murphy, K.M., and S.L. Reiner. 2002. The lineage decisions of helper T cells. Nat. Rev. Immunol. 2:933–944. - PubMed
- Glimcher, L.H., and K.M. Murphy. 2000. Lineage commitment in the immune system: the T helper lymphocyte grows up. Genes Dev. 14:1693–1711. - PubMed
- Weiner, H.L. 2001. Induction and mechanism of action of transforming growth factor-β-secreting Th3 regulatory cells. Immunol. Rev. 182:207–214. - PubMed
Publication types
MeSH terms
Substances
LinkOut - more resources
Full Text Sources
Other Literature Sources
Molecular Biology Databases
Research Materials
Miscellaneous
