Lambda interferon (IFN-lambda), a type III IFN, is induced by viruses and IFNs and displays potent antiviral activity against select virus infections in vivo - PubMed (original) (raw)
Lambda interferon (IFN-lambda), a type III IFN, is induced by viruses and IFNs and displays potent antiviral activity against select virus infections in vivo
Nina Ank et al. J Virol. 2006 May.
Abstract
Type III interferons (IFNs) (interleukin-28/29 or lambda interferon [IFN-lambda]) are cytokines with IFN-like activities. Here we show that several classes of viruses induce expression of IFN-lambda1 and -lambda2/3 in similar patterns. The IFN-lambdas were-unlike alpha/beta interferon (IFN-alpha/beta)-induced directly by stimulation with IFN-alpha or -lambda, thus identifying type III IFNs as IFN-stimulated genes. In vitro assays revealed that IFN-lambdas have appreciable antiviral activity against encephalomyocarditis virus (EMCV) but limited activity against herpes simplex virus type 2 (HSV-2), whereas IFN-alpha potently restricted both viruses. Using three murine models for generalized virus infections, we found that while recombinant IFN-alpha reduced the viral load after infection with EMCV, lymphocytic choriomeningitis virus (LCMV), and HSV-2, treatment with recombinant IFN-lambda in vivo did not affect viral load after infection with EMCV or LCMV but did reduce the hepatic viral titer of HSV-2. In a model for a localized HSV-2 infection, we further found that IFN-lambda completely blocked virus replication in the vaginal mucosa and totally prevented development of disease, in contrast to IFN-alpha, which had a more modest antiviral activity. Finally, pretreatment with IFN-lambda enhanced the levels of IFN-gamma in serum after HSV-2 infection. Thus, type III IFNs are expressed in response to most viruses and display potent antiviral activity in vivo against select viruses. The discrepancy between the observed antiviral activity in vitro and in vivo may suggest that IFN-lambda exerts a significant portion of its antiviral activity in vivo via stimulation of the immune system rather than through induction of the antiviral state.
Figures
FIG. 1.
Expression of IFN-β, IFN-α, IFN-λ2/3, and IFN-λ1 in A549 cells (A), HeLa cells (B), Raji cells (C), and U937 cells (D) after stimulation with HSV-2, EMCV, SeV, Reo, and IAV. The cells were seeded and infected with virus at a MOI of 1. Total cellular RNA was extracted 6 or 24 h after viral challenge, and gene expression was analyzed by real-time PCR. For A549 and HeLa cells, which are permissive for HSV-2 and EMCV, results could not be obtained at the late time points due to cytopathic effects. Results are shown as means ± SD (error bars). ND, not done.
FIG. 2.
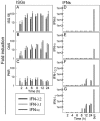
Expression of ISGs and IFNs in HepG2 cells after stimulation with IFN-λ1, IFN-λ2, or IFN-α. The cells were seeded and treated with 125 ng/ml of IFN-λ1, -λ2, or -α (i.e., ∼125 IU/ml IFN-α). Total cellular RNA was extracted 2, 4, 6, 8, 12, or 24 h after stimulation, and expression of (A) ISG56, (B) OAS, (C) PKR, (D) IFN-β, (E) IFN-α, (F) IFN-λ2/3, and (G) IFN-λ1 was analyzed by real-time PCR. For a positive control, RNA was harvested from A549 cells infected for 6 h with SeV. The results are shown as means ± SD (error bars).
FIG. 3.
Antiviral activity of type I and III IFNs against EMCV and HSV-2. (A-B) IFN-λ2, IFN-λ1, and IFN-α were added at the indicated doses (for IFN-α, 1 ng is ∼1 IU) to HepG2 cells 24 h prior to challenge with EMCV (A) or HSV-2 (B). Forty-eight and 96 h after infection with EMCV and HSV-2, respectively, cells were assayed for viability with a bioassay. The results are shown as means ± SD (error bars). _A_570 values were directly proportional to cell viability and therefore antiviral activity of the respective IFNs. IFN-α treatment without viral challenge was used as a baseline of the viability of the cells (n = 4 to 12). (C-D) Virus yield assay. The cells were treated with 103 ng/ml of IFN-λ2, IFN-λ1, and IFN-α and infected 24 h later at a MOI of 0.015 (103 PFU/ml) or a MOI of 0.15 (104 PFU/ml) with EMCV (C) or HSV-2 (D). Cell culture supernatants were harvested 12 h (C) and 24 h (D) later and assayed for infectious virus by titration on Vero cells. The results are shown as mean viral titers ± SD (error bars). (E-F) Antiviral effects of cotreatment with type I and III IFNs. HepG2 cells were seeded and treated with the indicated doses of IFNs 24 h prior to infection with 105 PFU/ml of EMCV (E) and 104 PFU/ml of HSV-2 (F). Forty-eight and 96 h after infection with EMCV and HSV-2, respectively, cells were assayed for viability with a bioassay. The results are shown as means ± SD (error bars).
FIG. 4.
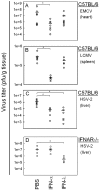
Viral loads in organs from C57BL/6 (A-C) or IFNAR−/− mice (D) after infection with (A) EMCV infection (hearts), (B) LCMV (spleens), and (C-D) HSV-2 (livers). Six hours prior to infection, the animals were treated with either PBS or with 10 μg of IFN-α (10,000 IU) or IFN-λ. The animals were infected i.p with EMCV (1 × 10³ PFU) or HSV-2 (1 × 10⁶ PFU) or i.v. with LCMV (1 × 10³ PFU). After 48 h of infection, the mice were sacrificed and organs were harvested for determination of viral load. The results are shown as virus titer for individual animals. Statistically significant differences in viral load evoked by IFN treatment (P < 0.05) are marked by asterisks (n = 5 to 8). Mean values are shown as horizontal lines.
FIG. 5.
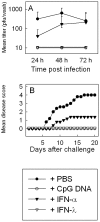
Viral load and disease progression after vaginal HSV-2 infection in C57BL/6 mice. Five days prior to infection, the mice were treated with Depo-Provera. Six or 24 h before infection, the mice were treated with 5 μg of IFN-α (5,000 IU), IFN-λ, PBS, or CpG DNA. The animals were infected i.vag. with 6.7 × 10⁴ PFU of HSV-2, and vaginal washes were performed at the indicated time points postinfection. (A) Viral load in vaginal washes 24, 48, and 72 h after infection. The results are shown as mean values ± SD (error bars). (B) Development of inflammation and disease up to 20 days after infection. Disease scores are explained in detail in Materials and Methods, but a disease score of 0 was given to a healthy mouse and a score of 5 was given for death or sacrifice of a mouse due to hind limb paralysis. The results are shown as mean values (n = 5).
FIG. 6.
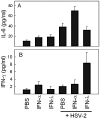
Effect of IFN-α or -λ treatment on HSV-2-induced serum cytokine levels. Mice were treated with PBS or 10 μg of the IFNs (i.e., 10,000 IU in the case of IFN-α) for 12 h before receiving i.p. infection with HSV-2 (1 × 10⁶ PFU). Six hours postinfection, the mice were sacrificed, serum was harvested, and cytokine levels were measured by Luminex. The results are shown as mean values ± SD (error bars) (n = 4).
Similar articles
- Murine interferon lambdas (type III interferons) exhibit potent antiviral activity in vivo in a poxvirus infection model.
Bartlett NW, Buttigieg K, Kotenko SV, Smith GL. Bartlett NW, et al. J Gen Virol. 2005 Jun;86(Pt 6):1589-1596. doi: 10.1099/vir.0.80904-0. J Gen Virol. 2005. PMID: 15914836 - Herpes simplex virus type 2 virion host shutoff protein regulates alpha/beta interferon but not adaptive immune responses during primary infection in vivo.
Murphy JA, Duerst RJ, Smith TJ, Morrison LA. Murphy JA, et al. J Virol. 2003 Sep;77(17):9337-45. doi: 10.1128/jvi.77.17.9337-9345.2003. J Virol. 2003. PMID: 12915549 Free PMC article. - A sustained type I IFN-neutrophil-IL-18 axis drives pathology during mucosal viral infection.
Lebratti T, Lim YS, Cofie A, Andhey P, Jiang X, Scott J, Fabbrizi MR, Ozantürk AN, Pham C, Clemens R, Artyomov M, Dinauer M, Shin H. Lebratti T, et al. Elife. 2021 May 28;10:e65762. doi: 10.7554/eLife.65762. Elife. 2021. PMID: 34047696 Free PMC article. - Interferons lambda, new cytokines with antiviral activity.
Lopušná K, Režuchová I, Betáková T, Skovranová L, Tomašková J, Lukáčiková L, Kabát P. Lopušná K, et al. Acta Virol. 2013;57(2):171-9. doi: 10.4149/av_2013_02_171. Acta Virol. 2013. PMID: 23600875 Review. - Herpesviruses and the Type III Interferon System.
Yin Y, Favoreel HW. Yin Y, et al. Virol Sin. 2021 Aug;36(4):577-587. doi: 10.1007/s12250-020-00330-2. Epub 2021 Jan 5. Virol Sin. 2021. PMID: 33400088 Free PMC article. Review.
Cited by
- Mice deficient in STAT1 but not STAT2 or IRF9 develop a lethal CD4+ T-cell-mediated disease following infection with lymphocytic choriomeningitis virus.
Hofer MJ, Li W, Manders P, Terry R, Lim SL, King NJ, Campbell IL. Hofer MJ, et al. J Virol. 2012 Jun;86(12):6932-46. doi: 10.1128/JVI.07147-11. Epub 2012 Apr 11. J Virol. 2012. PMID: 22496215 Free PMC article. - Induction and Evasion of Type-I Interferon Responses during Influenza A Virus Infection.
Muñoz-Moreno R, Martínez-Romero C, García-Sastre A. Muñoz-Moreno R, et al. Cold Spring Harb Perspect Med. 2021 Oct 1;11(10):a038414. doi: 10.1101/cshperspect.a038414. Cold Spring Harb Perspect Med. 2021. PMID: 32661015 Free PMC article. Review. - Varicella Viruses Inhibit Interferon-Stimulated JAK-STAT Signaling through Multiple Mechanisms.
Verweij MC, Wellish M, Whitmer T, Malouli D, Lapel M, Jonjić S, Haas JG, DeFilippis VR, Mahalingam R, Früh K. Verweij MC, et al. PLoS Pathog. 2015 May 14;11(5):e1004901. doi: 10.1371/journal.ppat.1004901. eCollection 2015 May. PLoS Pathog. 2015. PMID: 25973608 Free PMC article. - Pharmacogenomics of chronic hepatitis C therapy with genome-wide association studies.
Wang CH, Hwang Y, Lin E. Wang CH, et al. J Exp Pharmacol. 2010 Jun 23;2:73-82. doi: 10.2147/jep.s8655. eCollection 2010. J Exp Pharmacol. 2010. PMID: 27186094 Free PMC article. Review. - Neutralizing IFNL3 Autoantibodies in Severe COVID-19 Identified Using Molecular Indexing of Proteins by Self-Assembly.
Credle JJ, Gunn J, Sangkhapreecha P, Monaco DR, Zheng XA, Tsai HJ, Wilbon A, Morgenlander WR, Dong Y, Jayaraman S, Tosi L, Parekkadan B, Baer AN, Roederer M, Bloch EM, Tobian AAR, Zyskind I, Silverberg JI, Rosenberg AZ, Cox AL, Lloyd T, Mammen AL, Larman HB. Credle JJ, et al. bioRxiv [Preprint]. 2021 Mar 3:2021.03.02.432977. doi: 10.1101/2021.03.02.432977. bioRxiv. 2021. PMID: 33688651 Free PMC article. Preprint.
References
- Asselin-Paturel, C., A. Boonstra, M. Dalod, I. Durand, N. Yessaad, C. Dezutter-Dambuyant, A. Vicari, A. O'Garra, C. Biron, F. Briere, and G. Trinchieri. 2001. Mouse type I IFN-producing cells are immature APCs with plasmacytoid morphology. Nat. Immunol. 2:1144-1150. - PubMed
- Bartlett, N. W., K. Buttigieg, S. V. Kotenko, and G. L. Smith. 2005. Murine interferon lambdas (type III interferons) exhibit potent antiviral activity in vivo in a poxvirus infection model. J. Gen. Virol. 86:1589-1596. - PubMed
- Battegay, M., S. Cooper, A. Althage, J. Banziger, H. Hengartner, and R. M. Zinkernagel. 1991. Quantification of lymphocytic choriomeningitis virus with an immunological focus assay in 24- or 96-well plates. J. Virol. Methods 33:191-198. - PubMed
Publication types
MeSH terms
Substances
LinkOut - more resources
Full Text Sources
Other Literature Sources


