CRACM1 is a plasma membrane protein essential for store-operated Ca2+ entry - PubMed (original) (raw)
CRACM1 is a plasma membrane protein essential for store-operated Ca2+ entry
M Vig et al. Science. 2006.
Abstract
Store-operated Ca2+ entry is mediated by Ca2+ release-activated Ca2+ (CRAC) channels following Ca2+ release from intracellular stores. We performed a genome-wide RNA interference (RNAi) screen in Drosophila cells to identify proteins that inhibit store-operated Ca2+ influx. A secondary patch-clamp screen identified CRACM1 and CRACM2 (CRAC modulators 1 and 2) as modulators of Drosophila CRAC currents. We characterized the human ortholog of CRACM1, a plasma membrane-resident protein encoded by gene FLJ14466. Although overexpression of CRACM1 did not affect CRAC currents, RNAi-mediated knockdown disrupted its activation. CRACM1 could be the CRAC channel itself, a subunit of it, or a component of the CRAC signaling machinery.
Figures
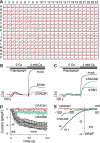
Fig. 1
Identification of CRACM1 and CRACM2 as crucial regulators of store-operated Ca2+ entry in Drosophila. (A) Ca2+ signals measured in Drosophila S2R+ cells in the primary high-throughput screen using FLIPR. Representative FLIPR raw data file showing 384 minigraphs, each of which represents fluo-4 fluorescence change in an individual well with respect to time. Each plate contained the negative control dsRNA Rho1 in well A1 and the positive control dsRNA stim1 in well B1. (B) Fluo-4 fluorescence changes in relative fluorescence units (r.f.u.) obtained from cells treated with the indicated dsRNAs. Cells were kept in Ca2+-free solution and exposed to thapsigargin (2 µM), followed by addition of 2 mM Ca2+. The traces are representative of two independent repeats of the primary screen. (C) Same protocol as in (B) but for cells treated with CRACM2 dsRNA. (D) Normalized average time course of IP3-induced (20 µM) _I_CRAC measured in Drosophila Kc cells. Currents of individual cells were measured at −80 mV, normalized by their respective cell size, averaged and plotted versus time (±SEM). Cytosolic calcium was clamped to 150 nM with 10 mM BAPTA and 4 mM CaCl2. Traces correspond to untreated control [wild type (wt), black filled circles, n = 10); Rho1 dsRNA (mock, open circles, n = 8); CRACM1 dsRNA (red circles, n = 6); and CRACM2 dsRNA (green circles, n = 9)]. (E) Averaged current-voltage (I/V) data traces of _I_CRAC extracted from representative cells at 60 s for currents evoked by 50-ms voltage ramps from −100 to +100 mV with leak currents subtracted and normalized to cell size (pF). Traces correspond to untreated control (wt, n = 9); CRACM1 dsRNA (n = 5); and CRACM2 dsRNA (n = 6).
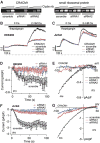
Fig. 2
Suppression of store-operated Ca2+ entry and _I_CRAC by CRACM1 siRNA. (A) (Left) RT-PCR of CRACM1 mRNA from HEK293 cells infected with the indicated CRACM1-specific siRNAs and a scrambled sequence control. (Right) Control with primers specific for small ribosomal protein. (B) Fura 2–AM (pentaacetoxymethyl ester) fluorescence measurements of [Ca2+]i in cells treated with scramble (control) or the two CRACM1-specific siRNAs in HEK293 cells. Cells were kept in Ca2+-free solution and exposed to thapsigargin (2 µM), followed by addition of 2 mM Ca2+. The traces are representative of three independent experiments. (C) Same protocol as in (B), but for Jurkat cells. The traces are averages of three independent experiments. (D) Normalized average time course of IP3-induced (20 µM) _I_CRAC measured in HEK293 cells treated with the indicated siRNAs (n = 9 to 13 for each group). [Ca2+]i was clamped to near zero by 10 mM BAPTA. (E) Current-voltage (I/V) data traces of _I_CRAC from representative cells at 60 s for currents evoked by 50-ms voltage ramps from −100 to +100 mV in cells treated with the indicated siRNAs (n = 7 to 10). (F and G) Same as panel (D) and (E), but for Jurkat cells (n = 8 to 9).
Fig. 3
Overexpression of CRACM1. (A) Analysis of HEK293 cells for overexpression of CRACM1 by immunoprecipitation with antibodies against Myc or C-terminal His and immunoblotting with antibody against Myc. Control immunoprecipitation from empty vector-transfected cells did not show any bands. (B) Normalized average time course of IP3-induced (20 µM) _I_CRAC measured in HEK293 cells. Currents of individual cells were measured at −80 mV, normalized by their respective cell size, averaged, and plotted against time (± SEM). Cytosolic calcium was clamped to near zero by using 10 mM BAPTA. Traces correspond to cells transfected with GFP alone (control, black circles, n = 13) and cells transfected with GFP plus CRACM1 (red circles, n = 14). (C) Immunofluorescence localization of CRACM1 in HEK293 cells visualized by confocal microscopy. Immunostaining for CRACM1–flag–N terminus (top) or CRACM1–Myc–C terminus (bottom) in intact (left) and permeabilized cells (right). (D) Same as bottom right panel of (C), but at higher magnification of selected cells to illustrate plasma membrane staining.
Similar articles
- Amplification of CRAC current by STIM1 and CRACM1 (Orai1).
Peinelt C, Vig M, Koomoa DL, Beck A, Nadler MJ, Koblan-Huberson M, Lis A, Fleig A, Penner R, Kinet JP. Peinelt C, et al. Nat Cell Biol. 2006 Jul;8(7):771-3. doi: 10.1038/ncb1435. Epub 2006 May 30. Nat Cell Biol. 2006. PMID: 16733527 Free PMC article. - STIM1, an essential and conserved component of store-operated Ca2+ channel function.
Roos J, DiGregorio PJ, Yeromin AV, Ohlsen K, Lioudyno M, Zhang S, Safrina O, Kozak JA, Wagner SL, Cahalan MD, Veliçelebi G, Stauderman KA. Roos J, et al. J Cell Biol. 2005 May 9;169(3):435-45. doi: 10.1083/jcb.200502019. Epub 2005 May 2. J Cell Biol. 2005. PMID: 15866891 Free PMC article. - STIM1 is a Ca2+ sensor that activates CRAC channels and migrates from the Ca2+ store to the plasma membrane.
Zhang SL, Yu Y, Roos J, Kozak JA, Deerinck TJ, Ellisman MH, Stauderman KA, Cahalan MD. Zhang SL, et al. Nature. 2005 Oct 6;437(7060):902-5. doi: 10.1038/nature04147. Nature. 2005. PMID: 16208375 Free PMC article. - The molecular choreography of a store-operated calcium channel.
Lewis RS. Lewis RS. Nature. 2007 Mar 15;446(7133):284-7. doi: 10.1038/nature05637. Nature. 2007. PMID: 17361175 Review. - Signalling to transcription: store-operated Ca2+ entry and NFAT activation in lymphocytes.
Gwack Y, Feske S, Srikanth S, Hogan PG, Rao A. Gwack Y, et al. Cell Calcium. 2007 Aug;42(2):145-56. doi: 10.1016/j.ceca.2007.03.007. Epub 2007 Jun 18. Cell Calcium. 2007. PMID: 17572487 Review.
Cited by
- Ca2+ Signaling but Not Store-Operated Ca2+ Entry Is Required for the Function of Macrophages and Dendritic Cells.
Vaeth M, Zee I, Concepcion AR, Maus M, Shaw P, Portal-Celhay C, Zahra A, Kozhaya L, Weidinger C, Philips J, Unutmaz D, Feske S. Vaeth M, et al. J Immunol. 2015 Aug 1;195(3):1202-17. doi: 10.4049/jimmunol.1403013. Epub 2015 Jun 24. J Immunol. 2015. PMID: 26109647 Free PMC article. - Role of the store-operated calcium entry protein, STIM1, in neutrophil chemotaxis and infiltration into a murine model of psoriasis-inflamed skin.
Steinckwich N, Myers P, Janardhan KS, Flagler ND, King D, Petranka JG, Putney JW. Steinckwich N, et al. FASEB J. 2015 Jul;29(7):3003-13. doi: 10.1096/fj.14-265215. Epub 2015 Apr 2. FASEB J. 2015. PMID: 25837581 Free PMC article. - Side-by-side comparison of published small molecule inhibitors against thapsigargin-induced store-operated Ca2+ entry in HEK293 cells.
Norman K, Hemmings KE, Shawer H, Appleby HL, Burnett AJ, Hamzah N, Gosain R, Woodhouse EM, Beech DJ, Foster R, Bailey MA. Norman K, et al. PLoS One. 2024 Jan 23;19(1):e0296065. doi: 10.1371/journal.pone.0296065. eCollection 2024. PLoS One. 2024. PMID: 38261554 Free PMC article. - STIM1 regulates platelet-derived growth factor-induced migration and Ca2+ influx in human airway smooth muscle cells.
Suganuma N, Ito S, Aso H, Kondo M, Sato M, Sokabe M, Hasegawa Y. Suganuma N, et al. PLoS One. 2012;7(9):e45056. doi: 10.1371/journal.pone.0045056. Epub 2012 Sep 11. PLoS One. 2012. PMID: 22984609 Free PMC article. - Ion channels in innate and adaptive immunity.
Feske S, Wulff H, Skolnik EY. Feske S, et al. Annu Rev Immunol. 2015;33:291-353. doi: 10.1146/annurev-immunol-032414-112212. Annu Rev Immunol. 2015. PMID: 25861976 Free PMC article. Review.
References
- Putney JW., Jr Cell Calcium. 1990;11:611. - PubMed
- Hoth M, Penner R. Nature. 1992;355:353. - PubMed
- Parekh AB, Penner R. Physiol. Rev. 1997;77:901. - PubMed
- Parekh AB, Putney JW., Jr Physiol. Rev. 2005;85:757. - PubMed
- Partiseti M, et al. J. Biol. Chem. 1994;269:32327. - PubMed
Publication types
MeSH terms
Substances
Grants and funding
- R01 NS040927/NS/NINDS NIH HHS/United States
- R01-NS040927/NS/NINDS NIH HHS/United States
- R01 AI050200/AI/NIAID NIH HHS/United States
- 5-R37-GM053950/GM/NIGMS NIH HHS/United States
- R37 GM053950/GM/NIGMS NIH HHS/United States
- R01-AI050200/AI/NIAID NIH HHS/United States
- R01 GM065360/GM/NIGMS NIH HHS/United States
- R01-GM065360/GM/NIGMS NIH HHS/United States
LinkOut - more resources
Full Text Sources
Other Literature Sources
Molecular Biology Databases
Miscellaneous


