The circadian basis of winter depression - PubMed (original) (raw)
Controlled Clinical Trial
. 2006 May 9;103(19):7414-9.
doi: 10.1073/pnas.0602425103. Epub 2006 Apr 28.
Affiliations
- PMID: 16648247
- PMCID: PMC1450113
- DOI: 10.1073/pnas.0602425103
Controlled Clinical Trial
The circadian basis of winter depression
Alfred J Lewy et al. Proc Natl Acad Sci U S A. 2006.
Abstract
The following test of the circadian phase-shift hypothesis for patients with winter depression (seasonal affective disorder, or SAD) uses low-dose melatonin administration in the morning or afternoon/evening to induce phase delays or phase advances, respectively, without causing sleepiness. Correlations between depression ratings and circadian phase revealed a therapeutic window for optimal alignment of circadian rhythms that also appears to be useful for phase-typing SAD patients for the purpose of administering treatment at the correct time. These analyses also provide estimates of the circadian component of SAD that may apply to the antidepressant mechanism of action of appropriately timed bright light exposure, the treatment of choice. SAD may be the first psychiatric disorder in which a physiological marker correlates with symptom severity before, and in the course of, treatment in the same patients. The findings support the phase-shift hypothesis for SAD, as well as suggest a way to assess the circadian component of other psychiatric, sleep, and chronobiologic disorders.
Conflict of interest statement
Conflict of interest statement: A.J.L. is coinventor on several melatonin use-patents owned by Oregon Health & Science University currently not licensed to any company.
Figures
Fig. 1.
Schematic diagram of normal phase relationships (rounded to the nearest integer) between sleep phase markers, the 10 pg/ml plasma DLMO (10), and the core body temperature minimum (_T_min) (27, 32) derived from historical controls. The present study used the DLMO/midsleep interval PAD of 6 h as the hypothesized therapeutic window for optimal circadian alignment. Sleep times were determined actigraphically. Plasma melatonin levels were obtained under dim light every 30 min in the evening. The operational definition of the DLMO is the interpolated time of continuous rise above the threshold of 10 pg/ml; for example, if the melatonin level at 8 p.m. was 5 pg/ml and at 8:30 p.m. was 15 pg/ml, the DLMO would be 8:15 p.m.
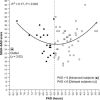
Fig. 2.
Pretreatment SIGH-SAD depression score as a function of PAD (the interval between the DLMO and midsleep). [The circled data point (from a 36-year-old female subject who was assigned to placebo treatment) was the only one that met outlier criteria (z = 3.02) and was therefore removed from all subsequent analyses and did not substantially affect any of the above findings (no outliers were detected in any other analyses).] The parabolic curve (minimum = 5.88) indicates that PAD accounts for 17% of the variance in SIGH-SAD scores [F (2, 65) = 6.43]. [A significant linear correlation was found for the absolute deviation from the parabolic minimum (r = 0.39, _r_2 = 0.15, df = 65, P = 0.001), confirming the validity of the parabolic curve fit.]
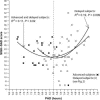
Fig. 3.
Posttreatment SIGH-SAD score as a function of PAD. The parabolic curve (minimum = 6.18) indicates that PAD accounts for 11% of the variance in SIGH-SAD scores [F (2, 65) = 3.96] for all subjects and 19% for phase-delayed subjects [F (2, 45) = 5.19]. Absolute deviations from the parabolic minima (6.18 and 5.85, respectively) were statistically significant (advanced and delayed subjects: r = 0.29, _r_2 = 0.09, df = 65, P = 0.02; delayed subjects: r = 0.48, _r_2 = 0.23, df = 65, P = 0.001).
Fig. 4.
Posttreatment SIGH-SAD score as a function of PAD in delayed subjects. (The parabolic curve and related statistics for the delayed subjects are provided in Fig. 3.) The linear correlation between PAD and SIGH-SAD score (diagonal hatched line) did not reach statistical significance, confirming that the parabolic curve in Fig. 3 for delayed subjects (_R_2 = 0.19, P = 0.009) is the better fit for these data. Directional linear correlations for under- and overshifters (to the right and left of PAD 6, respectively) were both statistically significant. The parabolic curve for subjects receiving PM melatonin indicates that PAD accounts for 65% of the variance in SIGH-SAD scores [F (2, 8) = 7.57; minimum = 5.56]; the correlation between the absolute deviation from the parabolic minimum was also statistically significant (r = 0.75, _r_2 = 0.56, df = 8, P = 0.01).
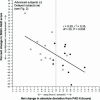
Fig. 5.
Percent change in SIGH-SAD score as a function of net change in absolute deviation toward and away from PAD 6 in PM-melatonin treated advanced and delayed subjects. Pretreatment vs. posttreatment shifts with respect to PAD 6 account for 35% of the variance.
Fig. 6.
Percent change in (SIGH-SAD) depression score after correct treatment, incorrect treatment, and placebo, as well as incorrect treatment and placebo combined (see text for details of the composition of these treatment groups). Baseline SIGH-SAD scores for the three treatment groups (correct treatment, incorrect treatment, and placebo) were 28.9 ± 1.0, 28.8 ± 1.3, and 26.6 ± 1.4, respectively. The Kruskal–Wallis H test (χ2 = 5.83, df = 2, P = 0.05) was statistically significant, but not the one-way ANOVA [F = 2.96 on (2, 65), P = 0.06]. By using the Welch two-sample t test to compare differences in the change scores of the correct-treatment group with those of the other groups, correct treatment significantly decreased depression ratings more than the other groups: incorrect (19.1%: t = 2.09, df = 40.8, P = 0.04); placebo (20.9%: t = 2.60, df = 34.2, P = 0.01); the latter two groups combined (19.9%: t = 2.65, df = 32.1, P = 0.01). Pretreatment to posttreatment percent changes were significant for all groups: correct (t = 5.43, df = 16, P < 0.001), incorrect (t = 2.20, df = 26, P = 0.04), placebo (t = 2.50, df = 23, P = 0.02), and the latter two groups combined (t = 3.25, df = 50, P = 0.002). Effect sizes (ES) are shown for pretreatment to posttreatment percent change scores for each group; also shown are the more conservative ES for differences in change scores between the correct-treatment group and the other groups. [Before phase typing, percent change in the PM-treated group was −28.5 ± 5.6, and percent change in the AM-treated group was −15.5 ± 8.0, although there were no statistically significant differences between the three treatment groups in percent changes in SIGH-SAD scores (see above).]
Similar articles
- The phase shift hypothesis for the circadian component of winter depression.
Lewy AJ, Rough JN, Songer JB, Mishra N, Yuhas K, Emens JS. Lewy AJ, et al. Dialogues Clin Neurosci. 2007;9(3):291-300. doi: 10.31887/DCNS.2007.9.3/alewy. Dialogues Clin Neurosci. 2007. PMID: 17969866 Free PMC article. Review. - Bright light therapy for winter depression--is phase advancing beneficial?
Burgess HJ, Fogg LF, Young MA, Eastman CI. Burgess HJ, et al. Chronobiol Int. 2004 Jul;21(4-5):759-75. doi: 10.1081/cbi-200025979. Chronobiol Int. 2004. PMID: 15470966 Clinical Trial. - Therapeutic mechanism in seasonal affective disorder: do fluoxetine and light operate through advancing circadian phase?
Murray G, Michalak EE, Levitt AJ, Levitan RD, Enns MW, Morehouse R, Lam RW. Murray G, et al. Chronobiol Int. 2005;22(5):937-43. doi: 10.1080/07420520500263292. Chronobiol Int. 2005. PMID: 16298778 Clinical Trial. - Melatonin marks circadian phase position and resets the endogenous circadian pacemaker in humans.
Lewy AJ, Sack RL, Blood ML, Bauer VK, Cutler NL, Thomas KH. Lewy AJ, et al. Ciba Found Symp. 1995;183:303-17; discussion 317-21. doi: 10.1002/9780470514597.ch15. Ciba Found Symp. 1995. PMID: 7656692 Review. - Human seasonal and circadian studies in Antarctica (Halley, 75°S).
Arendt J, Middleton B. Arendt J, et al. Gen Comp Endocrinol. 2018 Mar 1;258:250-258. doi: 10.1016/j.ygcen.2017.05.010. Epub 2017 May 17. Gen Comp Endocrinol. 2018. PMID: 28526480
Cited by
- Are short (blue) wavelengths necessary for light treatment of seasonal affective disorder?
Anderson JL, Hilaire MA, Auger RR, Glod CA, Crow SJ, Rivera AN, Salgado SM, Pullen SJ, Kaufman TK, Selby AJ, Wolfe DJ. Anderson JL, et al. Chronobiol Int. 2016;33(9):1267-1279. doi: 10.1080/07420528.2016.1207660. Epub 2016 Aug 5. Chronobiol Int. 2016. PMID: 27494399 Free PMC article. - Patterns of depressive symptom remission during the treatment of seasonal affective disorder with cognitive-behavioral therapy or light therapy.
Meyerhoff J, Young MA, Rohan KJ. Meyerhoff J, et al. Depress Anxiety. 2018 May;35(5):457-467. doi: 10.1002/da.22739. Epub 2018 Apr 16. Depress Anxiety. 2018. PMID: 29659120 Free PMC article. Clinical Trial. - Relationships between circadian measures, depression, and response to antidepressant treatment: A preliminary investigation.
Swanson LM, Burgess HJ, Huntley ED, Bertram H, Mooney A, Zollars J, Dopp R, Hoffmann R, Armitage R, Todd Arnedt J. Swanson LM, et al. Psychiatry Res. 2017 Jun;252:262-269. doi: 10.1016/j.psychres.2017.03.010. Epub 2017 Mar 8. Psychiatry Res. 2017. PMID: 28285255 Free PMC article. Clinical Trial. - Elusive hypersomnolence in seasonal affective disorder: actigraphic and self-reported sleep in and out of depressive episodes.
Wescott DL, Franzen PL, Hasler BP, Miller MA, Soehner AM, Smagula SF, Wallace ML, Hall MH, Roecklein KA. Wescott DL, et al. Psychol Med. 2023 Mar;53(4):1313-1322. doi: 10.1017/S003329172100283X. Epub 2021 Jul 29. Psychol Med. 2023. PMID: 37010222 Free PMC article. - A Review of Melatonin, Its Receptors and Drugs.
Emet M, Ozcan H, Ozel L, Yayla M, Halici Z, Hacimuftuoglu A. Emet M, et al. Eurasian J Med. 2016 Jun;48(2):135-41. doi: 10.5152/eurasianjmed.2015.0267. Eurasian J Med. 2016. PMID: 27551178 Free PMC article. Review.
References
- Lewy A. J., Bauer V. K., Ahmed S., Thomas K. H., Cutler N. L., Singer C. M., Moffit M. T., Sack R. L. Chronobiol. Int. 1998;15:71–83. - PubMed
- Sack R. L., Brandes R. W., Kendall A. R., Lewy A. J. N. Engl. J. Med. 2000;343:1070–1077. - PubMed
- Hack L. M., Lockley S. W., Arendt J., Skene D. J. J. Biol. Rhythms. 2003;18:420–429. - PubMed
- Bunney B. G., Potkin S. G., Bunney W. E. In: Biology of Depression: From Novel Insights to Therapeutic Strategies. Licinio J., Wong M. L., editors. Vol. 1. Hoboken, NJ: Wiley; 2005. pp. 467–483.
- Rosenthal N. E. Winter Blues. New York: Guilford; 1998.
Publication types
MeSH terms
Substances
Grants and funding
- R01 MH55703/MH/NIMH NIH HHS/United States
- K23 RR017636-01/RR/NCRR NIH HHS/United States
- R01 MH056874/MH/NIMH NIH HHS/United States
- R01 HD042125/HD/NICHD NIH HHS/United States
- 5M01 RR000334/RR/NCRR NIH HHS/United States
- R01 HD42125/HD/NICHD NIH HHS/United States
- R01 AG21826/AG/NIA NIH HHS/United States
- K23 RR017636/RR/NCRR NIH HHS/United States
- R01 AG021826/AG/NIA NIH HHS/United States
- M01 RR000334/RR/NCRR NIH HHS/United States
- R01 MH56874/MH/NIMH NIH HHS/United States
LinkOut - more resources
Full Text Sources
Other Literature Sources
Medical


