Regulation of cardiac stress signaling by protein kinase d1 - PubMed (original) (raw)
Comparative Study
Regulation of cardiac stress signaling by protein kinase d1
Brooke C Harrison et al. Mol Cell Biol. 2006 May.
Abstract
In response to pathological stresses such as hypertension or myocardial infarction, the heart undergoes a remodeling process that is associated with myocyte hypertrophy, myocyte death, and fibrosis. Histone deacetylase 5 (HDAC5) is a transcriptional repressor of cardiac remodeling that is subject to phosphorylation-dependent neutralization in response to stress signaling. Recent studies have suggested a role for protein kinase C (PKC) and its downstream effector, protein kinase D1 (PKD1), in the control of HDAC5 phosphorylation. While PKCs are well-documented regulators of cardiac signaling, the function of PKD1 in heart muscle remains unclear. Here, we demonstrate that PKD1 catalytic activity is stimulated in cardiac myocytes by diverse hypertrophic agonists that signal through G protein-coupled receptors (GPCRs) and Rho GTPases. PKD1 activation in cardiomyocytes occurs through PKC-dependent and -independent mechanisms. In vivo, cardiac PKD1 is activated in multiple rodent models of pathological cardiac remodeling. PKD1 activation correlates with phosphorylation-dependent nuclear export of HDAC5, and reduction of endogenous PKD1 expression with small interfering RNA suppresses HDAC5 shuttling and associated cardiomyocyte growth. Conversely, ectopic overexpression of constitutively active PKD1 in mouse heart leads to dilated cardiomyopathy. These findings support a role for PKD1 in the control of pathological remodeling of the heart via its ability to phosphorylate and neutralize HDAC5.
Figures
FIG. 1.
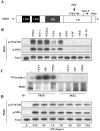
PKD1 activation by cardiac hypertrophic agonists. (A) Schematic representation of PKD1 structure showing the relative locations of known regulatory regions, including the two N-terminal, cysteine-rich domains (CRD), the pleckstrin homology (PH) domain, and the catalytic domain (Cat). Located within the catalytic domain are two activation-loop serine residues (S744/748) known to be targets for PKC-mediated phosphorylation. Upon phosphorylation by PKC, PKD1 undergoes autophosphorylation (Auto-P) on serine 916 (S916). (B) NRVMs were left untreated (−) or were stimulated for 1 h with the indicated agonists, as described in Materials and Methods. Immunoblotting experiments revealed agonist-dependent phosphorylation of both activation loop (S744/748) and autophosphorylation (S916) residues of PKD1. (C) Immunoprecipitation and in vitro kinase experiments using anti-PKD1 antibodies revealed increased Syntide-2 substrate phosphorylation by PKD1 derived from NRVMs stimulated with ET-1, PMA, or PE. Control pull-down experiments using an IKK-2-specific antibody showed no detectable Syntide-2 phosphorylation. Parallel immunoprecipitates were subjected to immunoblotting with anti-PKD1 antibodies (lower panels). Smearing is due to recognition of immunoprecipitating antibody by secondary immunoblotting antibody. (D) NRVMs were left untreated (0) or were stimulated with PE for the indicated times. Protein lysates were prepared and immunoblotted with the indicated antibodies.
FIG. 2.
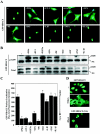
PKD1 activation correlates with nuclear export of HDAC5. (A) NRVMs were infected with adenovirus encoding GFP-HDAC5 and stimulated with the indicated agonists for 1 h. Cells were fixed and stained with Hoechst dye to reveal nuclei (blue). Only those agonists that increased PKD1 phosphorylation (PMA, ET-1, PGF2α, LPA, and PE) resulted in nuclear export of GFP-HDAC5. Hoechst staining is only shown in cases where HDAC5 underwent nuclear export. (B) NRVMs were infected with adenovirus encoding GFP-HDAC5 and treated as described for panel A. Protein lysates were subjected to immunoblotting with antibody that recognizes HDAC5 when phosphorylated on S259 (upper panel) or antibody to total HDAC5 (lower panel). NS, nonspecific. (C) Nuclear versus cytoplasmic distribution of GFP-HDAC5 was quantified with the Cellomics high-content imaging system, as described in Materials and Methods. Mean nuclear minus cytoplasmic fluorescence intensity was determined for at least 50 cells/well with 8 wells per condition. Higher values represent a greater abundance of GFP-HDAC5 in the nucleus. Values represent means ± standard deviations. Nuc, nuclear; cyto, cytoplasmic. (D) COS cells were cotransfected with either empty expression vector or a plasmid encoding constitutively active RhoA (0.5 μg/well) and a GFP-HDAC5 expression construct (1.0 μg/well). Overexpression of RhoA in COS cells stimulated nuclear export of GFP-HDAC5. An HDAC5 mutant harboring alanines in place of the PKD1 target serines (GFP-HDAC5 [S/A]) was resistant to RhoA-mediated nuclear export.
FIG. 3.
siRNA-mediated knockdown of PKD1 inhibits agonist-dependent nuclear export of GFP-HDAC5. (A) NRVMs were transfected with siRNA (100 nM) the day after plating. Cells were harvested at the indicated times posttransfection, and PKD1 levels were determined by immunoblotting. Cells transfected with PKD1-specific siRNA showed a time-dependent reduction in PKD1 protein expression. (B) RNA was prepared from NRVMs 48 h posttransfection with control or PKD1-directed siRNA. RT-PCR analysis of mRNA transcripts revealed PKD1-specific gene silencing with no effect on expression of PKD2 or PKD3. (C) NRVMs were transfected with control or PKD1-directed siRNA. One day following transfection, cells were infected with adenovirus encoding GFP-HDAC5. After 24 h of adenovirus infection, cells were stimulated for 1 h with ET-1 (50 nM), fixed, and imaged. (D) Manual quantification of GFP-HDAC5 cellular localization revealed a significant reduction in the ability of ET-1 to trigger nuclear export of GFP-HDAC5 in cells with reduced PKD1 expression. Cells were visualized and GFP-HDAC5 localization was classified as either prominent nuclear, cytosolic, or pan-cellular. Two independent investigators performed this analysis and obtained similar results. Values represent combined means ± standard errors of the means from three duplicate experiments. n = 100 cells per condition, per experiment.
FIG. 4.
siRNA-mediated knockdown of PKD1 inhibits cardiac hypertrophy. (A) NRVMs were transfected with control-directed siRNA or three distinct PKD1-directed siRNAs (#1 to #3; 100 nM) for 3 h. Cells were cultured in serum-free medium for 48 h prior to preparation of protein lysates. Endogenous levels of PKD1 protein were detected by immunoblotting. Blots were reprobed with anti-calnexin antibody to control for protein loading. (B) NRVMs were transiently transfected with the indicated siRNAs and either left untreated or stimulated with PE (20 μM) for an additional 48 h. Cell volumes were measured using a Coulter Counter. Values represent mean cubic micrometers (± standard errors of the means) for 60,000 cells from 6 independent culture wells. *, P < 0.0001 versus values for PE-treated control cells. (C) ANF abundance in culture supernatants from panel B was quantified by enzyme-linked immunosorbent assay and is represented as mean nanograms/milliliter (± standard deviations) from 6 independent culture wells per experimental condition. *, P < 0.0001 versus values for PE-treated control cells. (D) NRVMs were transfected and stimulated with PE as described for panel B. After 48 h of treatment, cells were fixed and sarcomeres were visualized by indirect immunofluorescence with sarcomeric α-actinin-specific antibodies. Reduction of PKD1 expression resulted in reduced sarcomere assembly and organization in agonist-treated cells.
FIG. 5.
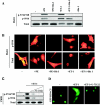
PKC-dependent and -independent activation of PKD1. (A) NRVMs were left unstimulated (−) or were treated for 1 h with PE (20 μM) or ET-1 (50 nM) in the absence or presence of the general PKC inhibitor Bis I (10 μM). Immunoblotting experiments of protein lysates revealed agonist-dependent phosphorylation of both activation loop (S744/748) and autophosphorylation (S916) sites in PKD1. (B) NRVMs were infected with adenovirus encoding wild-type PKD1 (multiplicity of infection, 20). Cells were left unstimulated (−) or were treated with PE (20 μM) or ET-1 (50 nM) for 1 h in the absence or presence of Bis I (10 μM). Cells were fixed, and the subcellular distribution of PKD1 was determined by immunofluorescence with antibodies against PKD1 phosphorylated at S916 (upper panels) or total PKD1 (lower panels). (C) Immunoblot analysis of PKD1 phosphorylation at S744/748 and S916 in NRVMs stimulated for 1 h with ET-1 (50 nM) in the absence or presence of the phospholipase C (PLC) inhibitor U-73122 (0.5 μM or 1.0 μM). (D) NRVMs were infected with adenovirus encoding GFP-HDAC5. Cells were stimulated with ET-1 (50 nM) in the absence or presence of U-73122 (1 μM). PLC inhibition completely blocked ET-1-mediated nuclear export of HDAC5.
FIG. 6.
PKD is activated during pathological cardiac hypertrophy in vivo. (A) Left ventricular protein extracts were prepared from 5-month-old Sprague-Dawley rats infused with norepinephrine (NE; 10 mg/kg) or vehicle control (saline) for 1 h. Levels of total PKD1, PKD1 phosphorylated by PKC on S744/748, and PKD1 autophosphorylated on S916 were determined by immunoblotting. (B) PKD1 activation state was analyzed in left ventricular tissues from 15- to 20-month-old spontaneously hypertensive, heart failure rats (SHHF) or age-matched Wistar-Furth (WF) control rats, as described for panel A. (C) Left ventricular protein from three independent WF or SHHF rats was immunoprecipitated with anti-PKD1 antibody, and immunoprecipitates were incorporated into in vitro kinase assays with Syntide-2 substrate and [32P]ATP. Increased phosphorylation of S916 correlates in elevated PKD1 kinase activity. (D) Three-month-old SHHF rats were subjected to thoracic aortic banding, as described in Materials and Methods. Thoracic aortic banding (TAB) exaggerates PKD1 activation in SHHF rat hearts. The apparent difference in PKD1 phosphorylation state in panels B (SHHF) and D (sham) is due to differences in film exposure time.
FIG. 7.
Cardiac-specific overexpression of active PKD1 triggers pathological hypertrophy in mice. (A) PKD1 phosphorylation state in wild-type mice (WT) and two independent α-MyHC-PKD1 transgenic mouse lines (PKD1-Tg) was measured by immunoblotting with total heart protein lysates. (B) Histological sections revealed gross enlargement of ventricles and atria in 3-month-old PKD-Tg mice compared to WT littermates (upper panels, 1-month-old animals; middle panels, 3-month-old animals). Wall thinning and chamber dilation in PKD1-Tg mice was accompanied by myocyte disarray, sporadic myocyte hypertrophy, and increased interstitial space (lower panels, 3-month-old animals). (C) Total RNA was prepared from 10-week-old PKD1-Tg transgenic mice, WT littermates, or mice expressing constitutively active calcineurin in the heart (Cn-Tg). Expression of fetal cardiac genes for ANF, BNP, α-skeletal actin (α-Sk-Ac), and β-MyHC was assessed by quantitative RT-PCR. The bar graph indicates relative mRNA levels normalized by GAPDH. The relative level of mRNA in the wild type is assigned a value of 1.
FIG. 8.
Impaired cardiac function in PKD1 transgenic mice. (A) Representative M-mode images of wild-type (WT) or PKD1 transgenic (PKD1-Tg) mice at 4, 8, and 12 weeks of age. Data demonstrate initial LV dilation and wall thinning in PKD1 transgenic animals, which progresses in time and results in a decrease in cardiac function. (B) Bar graph representation of left ventricular internal diameter in diastole as well as fractional shortening and anterior wall thickness in systole. Values represent averages from the following animals (n): WT, 4 weeks old (4); WT, 6 weeks old (4); WT, 8 weeks old (3); WT, 12 weeks old (3); PKD1-Tg, 4 weeks old (8); PKD1-Tg, 6 weeks old (6); PKD1-Tg, 8 weeks old (6); and PKD1-Tg, 12 weeks old (3). PKD1 activation attenuates cardiac function and alters LV morphology in an age-dependent manner.
FIG. 9.
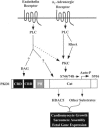
A model for PKC-dependent and −independent activation of PKD1 in the control of cardiac hypertrophy. Cardiac hypertrophic agonists that signal via the α1-AR or the ET-R stimulate PKC via PLC, resulting in PKC-directed phosphorylation of S744/748 in the activation loop of PKD1. In the case of the α1-AR, PKC signaling is required for activation of PKD1. The ET-R is able to stimulate PKD1 catalytic activity in the absence of PKC signaling. PKC-independent activation of PKD1 may involve direct binding of the PLC product diacylglycerol (DAG) to the cysteine-rich domains (CRDs) of PKD1 or posttranslational modification of PKD1 at sites other than S744/748. The small GTPase RhoA, which lies downstream of several cardiac GPCRs, stimulates PKD1 in a PKC-dependent manner. PKD1 signaling contributes to cardiomyocyte growth, sarcomere assembly, and fetal gene activation through phosphorylation of the antihypertrophic protein HDAC5 and likely other substrates.
Similar articles
- Protein kinase D1 mediates class IIa histone deacetylase phosphorylation and nuclear extrusion in intestinal epithelial cells: role in mitogenic signaling.
Sinnett-Smith J, Ni Y, Wang J, Ming M, Young SH, Rozengurt E. Sinnett-Smith J, et al. Am J Physiol Cell Physiol. 2014 May 15;306(10):C961-71. doi: 10.1152/ajpcell.00048.2014. Epub 2014 Mar 19. Am J Physiol Cell Physiol. 2014. PMID: 24647541 Free PMC article. - Liganded peroxisome proliferator-activated receptors (PPARs) preserve nuclear histone deacetylase 5 levels in endothelin-treated Sprague-Dawley rat cardiac myocytes.
Zhang H, Shao Z, Alibin CP, Acosta C, Anderson HD. Zhang H, et al. PLoS One. 2014 Dec 16;9(12):e115258. doi: 10.1371/journal.pone.0115258. eCollection 2014. PLoS One. 2014. PMID: 25514029 Free PMC article. - The CRM1 nuclear export receptor controls pathological cardiac gene expression.
Harrison BC, Roberts CR, Hood DB, Sweeney M, Gould JM, Bush EW, McKinsey TA. Harrison BC, et al. Mol Cell Biol. 2004 Dec;24(24):10636-49. doi: 10.1128/MCB.24.24.10636-10649.2004. Mol Cell Biol. 2004. PMID: 15572669 Free PMC article. - Decoding the Cardiac Actions of Protein Kinase D Isoforms.
Steinberg SF. Steinberg SF. Mol Pharmacol. 2021 Dec;100(6):558-567. doi: 10.1124/molpharm.121.000341. Epub 2021 Sep 16. Mol Pharmacol. 2021. PMID: 34531296 Free PMC article. Review. - Regulation of protein kinase D1 activity.
Steinberg SF. Steinberg SF. Mol Pharmacol. 2012 Mar;81(3):284-91. doi: 10.1124/mol.111.075986. Epub 2011 Dec 21. Mol Pharmacol. 2012. PMID: 22188925 Free PMC article. Review.
Cited by
- Signal-dependent repression of DUSP5 by class I HDACs controls nuclear ERK activity and cardiomyocyte hypertrophy.
Ferguson BS, Harrison BC, Jeong MY, Reid BG, Wempe MF, Wagner FF, Holson EB, McKinsey TA. Ferguson BS, et al. Proc Natl Acad Sci U S A. 2013 Jun 11;110(24):9806-11. doi: 10.1073/pnas.1301509110. Epub 2013 May 29. Proc Natl Acad Sci U S A. 2013. PMID: 23720316 Free PMC article. - Global comparison of phosphoproteins in human and rodent hearts: implications for translational studies of myosin light chain and troponin phosphorylations.
Kotlo K, Samarel AM, Chen HY, Aldstadt J, Danziger RS. Kotlo K, et al. Springerplus. 2016 Jun 21;5(1):808. doi: 10.1186/s40064-016-2469-x. eCollection 2016. Springerplus. 2016. PMID: 27390648 Free PMC article. - Phos-tag SDS-PAGE resolves agonist- and isoform-specific activation patterns for PKD2 and PKD3 in cardiomyocytes and cardiac fibroblasts.
Qiu W, Steinberg SF. Qiu W, et al. J Mol Cell Cardiol. 2016 Oct;99:14-22. doi: 10.1016/j.yjmcc.2016.08.005. Epub 2016 Aug 8. J Mol Cell Cardiol. 2016. PMID: 27515283 Free PMC article. - The Transcription Factor EB (TFEB) Sensitizes the Heart to Chronic Pressure Overload.
Wundersitz S, Pablo Tortola C, Schmidt S, Oliveira Vidal R, Kny M, Hahn A, Zanders L, Katus HA, Sauer S, Butter C, Luft FC, Müller OJ, Fielitz J. Wundersitz S, et al. Int J Mol Sci. 2022 May 25;23(11):5943. doi: 10.3390/ijms23115943. Int J Mol Sci. 2022. PMID: 35682624 Free PMC article. - HDAC5 catalytic activity suppresses cardiomyocyte oxidative stress and NRF2 target gene expression.
Hu T, Schreiter FC, Bagchi RA, Tatman PD, Hannink M, McKinsey TA. Hu T, et al. J Biol Chem. 2019 May 24;294(21):8640-8652. doi: 10.1074/jbc.RA118.007006. Epub 2019 Apr 8. J Biol Chem. 2019. PMID: 30962285 Free PMC article.
References
- Antos, C. L., T. A. McKinsey, M. Dreitz, L. M. Hollingsworth, C. L. Zhang, K. Schreiber, H. Rindt, R. J. Gorczynski, and E. N. Olson. 2003. Dose-dependent blockade to cardiomyocyte hypertrophy by histone deacetylase inhibitors. J. Biol. Chem. 278:28930-28937. - PubMed
- Auer, A., B. J. von Blume, S. Sturany, W. G. von Wichert, L. J. Van Lint, J. Vandenheede, G. Adler, and T. Seufferlein. 2005. Role of the regulatory domain of protein kinase D2 in phorbol ester binding, catalytic activity, and nucleocytoplasmic shuttling. Mol. Biol. Cell 16:4375-4385. - PMC - PubMed
- Bristow, M. R., N. E. Kantrowitz, R. Ginsburg, and M. B. Fowler. 1985. Beta-adrenergic function in heart muscle disease and heart failure. J. Mol. Cell Cardiol. 17(Suppl. 2):41-52. - PubMed
- Carnegie, G. K., F. D. Smith, G. McConnachie, L. K. Langeberg, and J. D. Scott. 2004. AKAP-Lbc nucleates a protein kinase D activation scaffold. Mol. Cell 15:889-899. - PubMed
Publication types
MeSH terms
Substances
LinkOut - more resources
Full Text Sources
Molecular Biology Databases


