Syndapin I is the phosphorylation-regulated dynamin I partner in synaptic vesicle endocytosis - PubMed (original) (raw)
Syndapin I is the phosphorylation-regulated dynamin I partner in synaptic vesicle endocytosis
Victor Anggono et al. Nat Neurosci. 2006 Jun.
Abstract
Dynamin I is dephosphorylated at Ser-774 and Ser-778 during synaptic vesicle endocytosis (SVE) in nerve terminals. Phosphorylation was proposed to regulate the assembly of an endocytic protein complex with amphiphysin or endophilin. Instead, we found it recruits syndapin I for SVE and does not control amphiphysin or endophilin binding in rat synaptosomes. After depolarization, syndapin showed a calcineurin-mediated interaction with dynamin. A peptide mimicking the phosphorylation sites disrupted the dynamin-syndapin complex, not the dynamin-endophilin complex, arrested SVE and produced glutamate release fatigue after repetitive stimulation. Pseudophosphorylation of Ser-774 or Ser-778 inhibited syndapin binding without affecting amphiphysin recruitment. Site mutagenesis to alanine arrested SVE in cultured neurons. The effects of the sites were additive for syndapin I binding and SVE. Thus syndapin I is a central component of the endocytic protein complex for SVE via stimulus-dependent recruitment to dynamin I and has a key role in synaptic transmission.
Figures
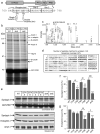
Fig. 1. Phosphorylation-dependent interaction of syndapin I and endophilin I with dynamin I in vitro
(a) Dynamin I consists of four distinct domains: the GTP hydrolysis domain (GTPase), a pleckstrin homology (PH) domain, an assembly domain (AD) and a proline-rich domain (PRD) and is phosphorylated by Cdk5 at Ser-774 and Ser-778 in vivo in the “phospho-box”. Point mutations were made in phospho-box residues at the indicated positions (arrows). (b) GST-DynI-PRD either WT, dmA or dmE coupled to GSH-sepharose were used in pull-down experiments from rat brain lysates. Bound proteins were separated by SDS-PAGE and stained with Coomassie Blue. Each labelled band was identified by MALDI-TOF mass spectrometry. The major band at 52 kDa (arrow) lost binding to DynI-PRD-dmE, revealing two underlying proteins identified as non-specific binding proteins (not shown). (c) MALDI-MS peptide mass spectrum of the 52 kDa band identified it as syndapin I. The intensity of the 4 largest peaks were reduced the indicated amounts for display purposes (X2.3 etc). * = Match to syndapin I by peptide mass fingerprinting; # = The peptide at m/z 1,006.50 was sequenced by tandem MS/MS and also matched syndapin I; C = Coomassie Blue peak; T = Trypsin autolysis product. (d) MALDI-MS revealed 42% sequence coverage of syndapin I, including many peptides not found in syndapins II or III. Figures (b-d) are representative of three independent experiments. (e) Effect of individual DynI-PRD mutants on binding of syndapin I in pull-down experiments (upper panels). The same pull-down samples were also blotted with anti-syndapin I, anti-endophilin I and anti-amphiphysin I antibodies (lower panels). The amount of syndapin I (f) or endophilin I (g) bound to GST-DynI-PRD mutants was quantified by densitometry analysis of Western blots (n = 5). Data was expressed as a percent of DynI-PRD-WT ± s.e.m. One-way ANOVA was applied (***, P<0.001 against DynI-WT; #, P<0.05; ##, P<0.01; ###, P<0.001 against DynI Ala mutants; ^, P<0.05; ^ ^, P<0.01 against DynI-dmE).
Fig. 2. Phosphorylation-dependent interaction of syndapin I with dynamin I in vivo
(a) Amphiphysin I SH3 domain binds all synaptosomal dynamin I. GST-AmphI-SH3 bound to GSH-sepharose was used in pull-down experiments from P2 synaptosomes lysed in Triton X-100 in the presence of 150 mM NaCl. Dynamin I (arrow, top panel) was extracted in quadruplicate. GST-AmphI-SH3 was used in the 2nd sequential pull-down (middle panel) to recover any remaining unbound dynamin I. In the 3rd pull-down GST-SdpnI-SH3 or GST-Endo1-SH3 were used to recover any remaining unbound dynamin I (bottom panel, each was in duplicate). The band migrating above the position of dynamin was a bacterial contaminant of the recombinant protein expression. All panels were from samples loaded onto the same gel. (b) Effect of in vivo dynamin I phosphorylation on binding to the SH3 domains of syndapin I or endophilin I. GST-SdpnI-SH3 and GST-EndoI-SH3 were used in pull-down experiments from P2 synaptosomes lysed in Triton X-100 in the absence or presence of 150 mM NaCl. GST-AmphI-SH3 was used sequentially in the 2nd pull-down to recover any remaining unbound dynamin I. Dynamin I was detected by Coomassie Blue staining of gels (top two panels). Lysates from the same experiment were probed with antibodies to phospho-Ser-774 and phospho-Ser-778 (bottom four panels). (c) Effect of in vivo dynamin I phosphorylation on binding to full length syndapin I or endophilin I. Rat brain P2 synaptosomes were labelled with 32Pi and lysed with Triton X-100 in the presence of 150 mM NaCl. GST-AmphI-SH3, GST-SdpnI-FL and GST-EndoI-FL (1st pull-down) and GST-AmphI-SH3 (2nd pull-down) were used in sequential pull-down experiments (in duplicate). Bound proteins were analysed by SDS-PAGE (top two panels) and phospho-dynamin I was visualised by autoradiography (lower two panels). All samples were run on the same gel. (d) Phospho-dynamin I from synaptosomes shows reduced binding to full length syndapin I but not to full length endophilin I. Quantitation of data such as in panel c from total protein levels (densitometry of the 1st pull-downs) and phospho-dynamin I levels (phosphorimager from 1st pull-down) are presented as a ratio and were normalised to the amphiphysin value. Results are the mean ± s.e.m. for n = 6. One-way ANOVA was applied (***, P<0.001 compared to amphiphysin I; ###, P<0.001 compared to endophilin I).
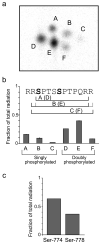
Fig. 3. Phosphopeptide mapping of dynamin I from synaptosomes
(a) Dynamin I from 32Pi-labelled synaptosomes was isolated by a pull-down with GST-AmphI-SH3, digested with trypsin and the isolated phosphopeptides were separated by 2-D tryptic maps. An autoradiograph is shown. (b) The amount of radiation associated with each spot from panel a was quantified by Storm phosphorimager (n = 2, error bars indicate range). The specific phosphopeptides that accounted for each spot were identified by MALDI-TOF MS (shown above each bar in b; peptides phosphorylated on both Ser-774 + Ser-778 are in brackets). Tandem MS/MS was used to sequence the phosphorylation site in peptides A and D and B and E (not shown). Note that due to the presence of two Arg residues at each end of the phospho-box, peptides B and E have the Arg at either end (shown with a dashed line) and each presents in two forms which are chemically identical. The phosphopeptides were identified as the following dynamin I sequences with phosphorylation at Ser-774 (A-C) or Ser-774 + Ser-778 (D-F): A 774-783 + 80, m/z = 1,137.6; B 773-783 + 80 and/or 774-784 +80, m/z = 1,293.6; C 773-784 + 80, m/z = 1,449.8; D 774-783 + 160, m/z = 1,217.5; E 773-783 + 160 and/or 774-784 +160, m/z = 1,373.7; E 773-784 + 160, m/z = 1,529.6. (c) Phospho-Ser-774 predominates 2:1. The in vivo radiation distributed between Ser-774 and Ser-778 was expressed as a percent of the total 32Pi incorporated into all these phosphopeptides (63% Ser-774 and 37% Ser-778; n = 2, error bars indicating range are too small to be seen).
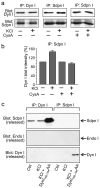
Fig. 4. Depolarization-regulated interaction of syndapin I with dynamin I in synaptosomes
(a) A dynamin I-syndapin I complex in synaptosomes. Synaptosomes were preincubated in the presence or absence of 40 μM cyclosporin A (CysA), stimulated for 5 s (30 mM KCl), lysed, co-immunoprecipitated (Co-IP) then were blotted for dynamin I and syndapin I as indicated. Blots are representative of at least 3 independent experiments. (b) Depolarisation stimulates the formation of a calcineurin-sensitive dynamin I-syndapin I complex. The amount of dynamin I immunoprecipitated by the syndapin I antibody (as in panel a) was quantified using densitometry (n = 3, data are mean ± s.e.m.). (c) The phospho-box peptide releases syndapin I from the complex. Co-IPs were performed in synaptosome lysates using antisera against either dynamin I or syndapin I from either resting (Ctrl) or stimulated (30 mM KCl) synaptosomes. After immunoprecipitation, DynI769-784AA phospho-box peptide (2 mM) was added to protein complexes retained on the beads. Samples released from the beads by this treatment were blotted for either syndapin I (upper panel), endophilin I (middle panel) or dynamin I (lower panel). The endophilin blot included a positive control (not shown). Blots are representative of two independent experiments.
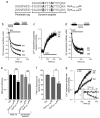
Fig. 5. Dynamin I phospho-box peptide inhibits SVE in nerve terminals
(a) Sequences of two penetratin-linked synthetic peptides made from the sequences in the phospho-box. (b) The AA mutant blocks SV turnover. Synaptosomes were preincubated in the presence or absence of either penetratin peptide (250 μM) for 30 minutes prior to FM2-10 loading stimulated by 30 mM KCl. Accumulated FM2-10 was unloaded by stimulation with another pulse of 30 mM KCl (indicated by the solid bar). Ca2+-dependent unloading (SV turnover) is displayed for control (Ctrl) or peptide treated synaptosomes. (c) Ca2+-dependent glutamate release from control (Ctrl) or peptide-treated synaptosomes stimulated with 30 mM KCl (solid bar) is unaffected by either peptide. (d) Both peptides have small background effects on SV exocytosis. Synaptosomes were loaded with FM2-10 using a 30 mM KCl stimulus for 2 min and were then incubated for 30 min in the presence or absence of either peptide (250 μM). Unloading of dye was measured by the Ca2+-dependent fluorescence released upon subsequent stimulation with 30 mM KCl (solid bar). (b-d) n ≥ 3. (e) SVE is specifically inhibited by the AA peptide. Retrieval efficiency (SV turnover / exocytosis) is displayed using exocytosis data from either panels c or d. (f) Synaptosomes were loaded with FM2-10 as in panel b before being hypotonically lysed. SVs were purified and their fluorescence values were corrected for dye uptake in the absence of Ca2+ (Ca2+-dependent) and normalised to control (n = 3, mean ± s.e.m.). In e & f one-way ANOVA was applied (***, P<0.001; **, P<0.01 peptides compared to control: ###, P<0.001; #, P<0.05 DynI769-784AA compared to DynI769-784EE.). (g) Ca2+-dependent glutamate release from control (Ctrl) or peptide-treated synaptosomes stimulated with 4-AP (1 mM, solid bar), n = 3, using methods as described in panel e. The inset shows the same data for glutamate release for the AA or EE peptides subtracted from the control exocytosis (Δ) to emphasise the activity-dependent nature of the rundown in glutamate release. The inset is also zoomed on the first 3 minutes from 4-AP addition (which was at 60 sec) to highlight the lack of effect during the first 45 s.
Fig. 6. DynIdmA and DynIdmE inhibit SVE in cerebellar granule neurons
(a) Primary cultures of CGNs were transfected with DynIWT-GFP (green) and stimulated uptake of FM4-64 (red) was visualized by fluorescence microscopy. Note that axons from both transfected and untransfected neurons inter-twine. (b) Monochrome FM4-64 image shows puncta representing sites of SV turnover. (c) CGNs were depolarized to unload the accumulated FM4-64. The fluorescence of all puncta was reduced. After transfection of DynIdmA-GFP (d-f) or DynIdmE-GFP (g-i) into CGNs there was considerably less accumulation of FM4-64 (e and h). Scale bar is 5 μm. (j) The extent of FM4-64 accumulation and thus of SV turnover, was quantified from the change in fluorescence (ΔF) by unloading the CGN nerve terminals with two sequential KCl stimuli (S1 and S2). Solid bars indicate the period of stimulation. (k) Both Ser-774 and Ser-778 contribute to SV turnover in an additive fashion. Quantitative analysis shows the effects of Ser-774, Ser-778 and double mutations on SV turnover (ΔS1 + ΔS2). (l) SV exocytosis is unaffected. Exocytosis was determined by examining the kinetics of FM4-64 unloading. Data (k-l) was from 3-5 independent experiments for each mutant (n ≥ 30 for each transfected and n ≥ 1,744 for untransfected synaptic puncta) and was expressed as a percent of untransfected neurons ± s.e.m. One-way ANOVA was applied (***, P<0.001 against DynIWT; ###, P<0.001 against DynIdmE).
Fig. 7. Overexpression of DynIdmA and DynIdmE arrest SVE when assayed using synaptopHluorin
CGN cultures were co-transfected with synaptopHluorin and either DynIWT-mCerulean (a), DynIdmE-mCerulean (b) or DynIdmA-mCerulean (c). Representative time courses of synaptopHluorin fluorescence responses evoked by 50 mM KCl are displayed, with fluorescence normalised to a maximum of 1 unit. The change in fluorescence (ΔF) normalized to initial fluorescence (F0), averaged over the first six data points, is plotted as a function of time. The bar indicates the 20 s period of KCl addition. (d) Collated data showing the amount of fluorescence remaining (i.e. synaptopHlourin remaining on the cell surface) 60 s after termination of KCl stimulation (n = 27 DynIWT-mCerulean; n = 34 DynIdmE-mCerulean and n = 12 DynIdmA-mCerulean ± s.e.m.).
Similar articles
- Syndapin I and endophilin I bind overlapping proline-rich regions of dynamin I: role in synaptic vesicle endocytosis.
Anggono V, Robinson PJ. Anggono V, et al. J Neurochem. 2007 Aug;102(3):931-43. doi: 10.1111/j.1471-4159.2007.04574.x. Epub 2007 Apr 16. J Neurochem. 2007. PMID: 17437541 - The phospho-dependent dynamin-syndapin interaction triggers activity-dependent bulk endocytosis of synaptic vesicles.
Clayton EL, Anggono V, Smillie KJ, Chau N, Robinson PJ, Cousin MA. Clayton EL, et al. J Neurosci. 2009 Jun 17;29(24):7706-17. doi: 10.1523/JNEUROSCI.1976-09.2009. J Neurosci. 2009. PMID: 19535582 Free PMC article. - Cdk5 is essential for synaptic vesicle endocytosis.
Tan TC, Valova VA, Malladi CS, Graham ME, Berven LA, Jupp OJ, Hansra G, McClure SJ, Sarcevic B, Boadle RA, Larsen MR, Cousin MA, Robinson PJ. Tan TC, et al. Nat Cell Biol. 2003 Aug;5(8):701-10. doi: 10.1038/ncb1020. Nat Cell Biol. 2003. PMID: 12855954 - Amphiphysin I and regulation of synaptic vesicle endocytosis.
Wu Y, Matsui H, Tomizawa K. Wu Y, et al. Acta Med Okayama. 2009 Dec;63(6):305-23. doi: 10.18926/AMO/31822. Acta Med Okayama. 2009. PMID: 20035287 Review. - Dynamin I phosphorylation and the control of synaptic vesicle endocytosis.
Smillie KJ, Cousin MA. Smillie KJ, et al. Biochem Soc Symp. 2005;(72):87-97. doi: 10.1042/bss0720087. Biochem Soc Symp. 2005. PMID: 15649133 Free PMC article. Review.
Cited by
- Synaptic vesicle generation from activity-dependent bulk endosomes requires calcium and calcineurin.
Cheung G, Cousin MA. Cheung G, et al. J Neurosci. 2013 Feb 20;33(8):3370-9. doi: 10.1523/JNEUROSCI.4697-12.2013. J Neurosci. 2013. PMID: 23426665 Free PMC article. - Regulation of synaptic vesicle budding and dynamin function by an EHD ATPase.
Jakobsson J, Ackermann F, Andersson F, Larhammar D, Löw P, Brodin L. Jakobsson J, et al. J Neurosci. 2011 Sep 28;31(39):13972-80. doi: 10.1523/JNEUROSCI.1289-11.2011. J Neurosci. 2011. PMID: 21957258 Free PMC article. - ProSAP1 and membrane nanodomain-associated syndapin I promote postsynapse formation and function.
Schneider K, Seemann E, Liebmann L, Ahuja R, Koch D, Westermann M, Hübner CA, Kessels MM, Qualmann B. Schneider K, et al. J Cell Biol. 2014 Apr 28;205(2):197-215. doi: 10.1083/jcb.201307088. Epub 2014 Apr 21. J Cell Biol. 2014. PMID: 24751538 Free PMC article. - Endosome-mediated endocytic mechanism replenishes the majority of synaptic vesicles at mature CNS synapses in an activity-dependent manner.
Park J, Cho OY, Kim JA, Chang S. Park J, et al. Sci Rep. 2016 Aug 18;6:31807. doi: 10.1038/srep31807. Sci Rep. 2016. PMID: 27534442 Free PMC article. - A dynamic view of domain-motif interactions.
Akiva E, Friedlander G, Itzhaki Z, Margalit H. Akiva E, et al. PLoS Comput Biol. 2012 Jan;8(1):e1002341. doi: 10.1371/journal.pcbi.1002341. Epub 2012 Jan 12. PLoS Comput Biol. 2012. PMID: 22253583 Free PMC article.
References
- Cousin MA, Robinson PJ. The dephosphins: Dephosphorylation by calcineurin triggers synaptic vesicle endocytosis. Trends Neurosci. 2001;24:659–665. - PubMed
- Tan TC, et al. Cdk5 is essential for synaptic vesicle endocytosis. Nat. Cell Biol. 2003;5:701–710. - PubMed
- Floyd SR, et al. Amphiphysin binds the cdk5 regulatory subunit p35 and is phosphorylated by cdk5 and cdc2. J. Biol. Chem. 2001;276:8104–8110. - PubMed
Publication types
MeSH terms
Substances
LinkOut - more resources
Full Text Sources
Other Literature Sources
Molecular Biology Databases


