Monocytic leukemia zinc finger protein is essential for the development of long-term reconstituting hematopoietic stem cells - PubMed (original) (raw)
Monocytic leukemia zinc finger protein is essential for the development of long-term reconstituting hematopoietic stem cells
Tim Thomas et al. Genes Dev. 2006.
Abstract
Monocytic leukemia zinc finger protein (MOZ), a transcriptional coactivator and member of the MYST family of histone acetyltransferases, is the target of recurrent translocations in acute myeloid leukemia. Since genes associated with translocations in leukemia are typically important regulators of blood formation, we investigated if Moz has a role in normal hematopoiesis. We generated mice carrying a mutation in the Moz gene. Homozygous Moz mutant mice died at birth. Moz mutant fetal liver hematopoietic cells were incapable of contributing to the hematopoietic system of recipients after transplantation. We observed profound defects in the stem cell compartment of Moz-deficient mice. Progenitors of all lineages were reduced in number. However, blood cell lineage commitment was unaffected. Together, these results show that Moz is essential for a fundamental property of hematopoietic stem cells, the ability to reconstitute the hematopoietic system of a recipient after transplantation and that Moz is specifically required in the stem cell compartment.
Figures
Figure 1.
The MozΔ mutation. (A) Domain structure of Moz. (H15) H15 domain; (PHD) PHD zinc finger domain (C4HC3); (MYST) MYST histone acetyltransferase domain, the nucleosome-binding motif (C2HC) is indicated by a bar (arrowhead) within this domain; (Acidic) acidic domain; (Ser) serine-rich domain; (Met) methionine-rich domain. An arrow indicates where truncation of Moz protein was generated at amino acid 1538 by the in-frame insertion of the neo gene in the mutant allele. (B) Wild-type Moz allele showing 16 coding exons distributed over 80 kb. The C-terminal domains are encoded entirely by exon 16. (C) Mutant MozΔ allele after homologous recombination showing the insertion site of neo. (D) Southern analysis of BglII-digested genomic DNA showing the predicted fragment-length polymorphism after hybridization with a probe outside of the targeting construct, wild-type (+/+), heterozygous (Δ/+), and homozygous mutant (Δ/Δ) genomic DNA. (E) Northern analysis of MozΔ/Δ, MozΔ/+, and Moz+/+ littermate embryos at E13.5; note that the insertion of the neo coding sequences cause an increase mRNA of 1 kb. (F) Western analysis of MozΔ/Δ, MozΔ/+, and Moz+/+ littermate embryos using an antibody against neo. Note that no band corresponding to the Moz–neo fusion protein is detectable at the predicted size of 204 kD (indicated by arrow) in the Δ/Δ or Δ/+ lanes. In contrast, the two control lanes at the left show detection of the β-galactosidase–neo fusion protein (145 kD) produced in the cortex of Qkfgt (gt/+) mice but not present in the cortex of a wild-type littermate (+/+). Filter was exposed for 1 h. Note that bands ≥50 kD are the result of nonspecific binding.
Figure 2.
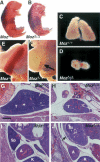
The MozΔ/Δ phenotype. Wild-type littermate (A) and homozygous (B) MozΔ/Δ E18.5 pup of a MozΔ/+ heterozygous intercross. Note that the homozygous MozΔ/Δ pup is cyanotic, indicating a lack of oxygenated blood (n = 32 E18.5 pups). Wild-type thymus (C) compared with MozΔ/Δ thymus (D) at E18.5. Wild-type spleen (E) compared with mutant spleen (arrow, F) at E18.5. Hematoxylin and eosin-stained transverse sections of E17.5 fetuses showing wild-type (G,I) and MozΔ/Δ littermate (H,J). Note dysgenic thymus (D,H) and dysgenic spleen (F,J) in mutant animals. (H) Minor bleeding and cystic remnants, probably of thymic origin (asterix). (J) The largest extent of the MozΔ/Δ spleen is shown (arrow). (A) Adrenal gland; (K) kidney; (Sp) spleen; (St) stomach; (T) thymus. Bar: G–J, 310 μm.
Figure 3.
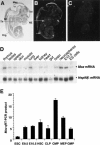
Moz is widely expressed both during embryogenesis and in the adult at low levels. (A–C) Radioactive in situ hybridization using a 2.8-kb probe to exon 16. Bright-field (A) and corresponding dark-field (B) images show that Moz is expressed in the thymus (Th, long arrow), the telencephalon (Tel), and nasal epithelium (NE, stippled arrow) at E13.5. In addition, Moz is expressed prominently in the dorsal root ganglia (Drg, short arrow), mesencephalon (Mes), and spinal cord (SC). (C) Sense control shows no hybridization above background. (D, top) Northern analysis, 10 μg total RNA per lane, shows Moz is expressed in most adult tissues, particularly in the thymus and lung where levels are similar to whole E12.5 embryo. Multipotent, proliferating cells isolated from adult brain and cultured as neurospheres also express Moz. (Bottom) Hsp90β mRNA as loading and transfer control. (E) Quantitative RT–PCR showing detection of Moz mRNA in cDNA prepared from hematopoietic stem cells (HSC), common lymphoid progenitors (CLP), common myeloid progenitors (CMP), megakaryocyte/erythroid progenitors (MEP), and granulocyte/macrophage progenitors (GMP) as compared with ES cells and E9.5 and E10.5 embryos.
Figure 4.
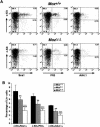
Fluorescence-activated cell analysis of early progenitor/stem cell populations in MozΔ/Δ, MozΔ/+, and Moz+/+ littermate fetal livers at E14.5. Fetal liver cells were stained with a cocktail of FITC-conjugated antibodies against the lineage markers Ter119, Gr-1 CD4, CD8, B220, and CD19. Mac-1 was not included, since fetal liver stem cells have been reported to be mac-1-positive (Morrison et al. 1995). In addition, cells were labeled with APC-conjugated c-Kit antibody and with either PE-conjugated anti-Sca1 or anti-AA4.1 or biotinylated anti-Flk2/Flt3 followed by PE-conjugated streptavidin. (A) Fluorescence-activated cell analysis profiles are shown for Moz+/+ fetal livers and MozΔ/Δ littermate fetal livers. The lineage-negative cell population was analyzed for c-Kit-, Sca1-, Flt3-, or AA4.1-positive cells as indicated. (B) Quantification of fluorescence-activated cell analysis results: n = 6 MozΔ/Δ, 3 MozΔ/+, and 3 Moz+/+ littermate fetal livers; MozΔ/Δ; MozΔ/+ ≠ Moz+/+; (***) P < 0.001; (**) P < 0.01; MozΔ/Δ ≠ MozΔ/+; (°°°) P < 0.001. Note the reduction in early progenitor/stem cell numbers in the MozΔ/Δ mutant and the intermediate levels in the MozΔ/+ heterozygotes. Data were analyzed by two-factorial analysis of variance with genotype and cell surface marker set as the independent factors, followed by Fisher’s post-hoc test.
Figure 5.
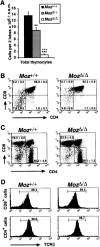
The thymus of MozΔ/Δ homozygous animals is able to support the differentiation of T cells. (A) Total cellularity of the MozΔ/Δ homozygous thymus is low at E18.5, with heterozygous animals having an intermediate cellularity: n = 5 MozΔ/Δ, 9 MozΔ/+, and 3 Moz+/+; MozΔ/Δ; MozΔ/+ ≠ Moz+/+; (***) P < 0.0001; (**) P < 0.01; _Moz_Δ/Δ ≠ MozΔ/+; (°°°) P < 0.0001. (B) Fluorescence-activated cell analysis shows the proportion of CD4/CD8 double-positive thymocytes is normal in MozΔ/Δ homozygous compared with littermate controls (Moz+/+) at E18.5. There is a significant reduction in the number of double-negative cells in the MozΔ/Δ homozygotes (P < 0.05). (C,D) After 12 d of fetal thymic organ culture, thymocytes of both MozΔ/Δ homozygous and littermate controls (Moz+/+) underwent further maturation to form both CD4 and CD8 single-positive cells (C) and recombined the T-cell receptor αβ subunits (TCRβ in D). Levels of TCRβ expression of single-positive cells gated in C are shown in D. Data were analyzed by one-factorial analysis of variance with genotype as the independent factor, followed by Fisher’s post-hoc test.
Figure 6.
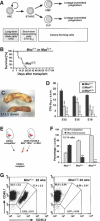
Fetal liver hematopoietic cells from MozΔ/Δ homozygous animals are severely deficient in short-term and long-term repopulating stem cells. (A) Schematic diagram showing the relationship between long-term repopulating cells (HSC) detected by competitive repopulation unit (CRU) assays, short-term repopulating cells (ST-HSC) detected by spleen colony-forming unit assays (CFU-S12), and lineage-committed progenitors identified in colony-forming cell assays. (B) Survival curve showing that lethally irradiated recipients receiving either heterozygous or wild-type E15.5 fetal liver cells from MozΔ/+ intercrosses survive, whereas mice receiving homozygous littermate cells die within 28 d (n = 17, 16, and 8 mice receiving MozΔ/Δ, MozΔ/+, Moz+/+ cells, respectively). Mice were intravenously injected with 10 × 106 to 19 × 106 cells. There was no correlation between the survival times of mice receiving a small or large number of homozygous cells. (C) CFU-S12 assays. Lethally irradiated recipients were injected with fetal liver cells from MozΔ/+ intercrosses at E12.5, E15.5, or E18.5. (Top) A representative spleen of mice injected with E15.5 wild-type (Moz+/+) fetal cells. (Bottom) A representative spleen of mice receiving cells from littermate MozΔ/Δ fetuses. (D) Absolute counts of spleen colonies larger than 0.5 mm: n = 11 MozΔ/Δ donors, 15 MozΔ/+ donors, and 15 Moz+/+ donors; MozΔ/Δ; MozΔ/+ ≠ Moz+/+; (***) P < 0.001; (**) P < 0.01; MozΔ/Δ ≠ MozΔ/+; (°°°) P < 0.0001; (°°) P < 0.01. Note the paucity of CFU-S12 cells derived from MozΔ/Δ animals and the intermediate levels derived from MozΔ/+ heterozygotes (D). Data were analyzed by two-factorial analysis of variance with genotype and developmental stage as the independent factors, followed by Fisher’s post-hoc test. (E) CRU assays. Lethally irradiated mice received a mixture of wild-type cells (1 × 10⁶) and cells from MozΔ/+ intercrosses at E15.5. Wild-type “competitor” cells were identified by the presence of the CD45.1 isoform, the “test” cells from MozΔ/+ intercrosses expressed both CD45.1 and CD45.2 isoforms, and any residual cells from the irradiated recipient expressed CD45.2 only. In different experiments, competitor cells and test cells were mixed in ratios of 1:1 and 1:4. (F,G) Combined fluorescence-activated cell analysis of peripheral blood leukocytes results from all experiments performed at 12–14 wk (F), and at 22 wk (G) after reconstitution show extensive contribution of wild-type (Moz+/+) fetal cells but no detectable contribution from homozygous littermates (MozΔ/Δ). (F) MozΔ/+ heterozygotes show an intermediate ability to competitively reconstitute the hosts. (G) Contribution of each CD45-isoform-positive population is indicated for experiments using wild-type (Moz+/+) and homozygous (MozΔ/Δ) fetal liver cells. Data are presented as combined percentage contribution after normalizing all input levels to a 1:1 ratio: n = 4 MozΔ/Δ donors, 9 MozΔ/+ donors, and 7 Moz+/+ donors; MozΔ/Δ; MozΔ/+ ≠ Moz+/+; (***) P < 0.0001; MozΔ/Δ ≠ MozΔ/+; (°°°) P < 0.0001. Data were analyzed by one-factorial analysis of variance with genotype as the independent factor, followed by Fisher’ post-hoc test.
Similar articles
- MOZ is essential for maintenance of hematopoietic stem cells.
Katsumoto T, Aikawa Y, Iwama A, Ueda S, Ichikawa H, Ochiya T, Kitabayashi I. Katsumoto T, et al. Genes Dev. 2006 May 15;20(10):1321-30. doi: 10.1101/gad.1393106. Genes Dev. 2006. PMID: 16702405 Free PMC article. - The histone acetyl transferase activity of monocytic leukemia zinc finger is critical for the proliferation of hematopoietic precursors.
Perez-Campo FM, Borrow J, Kouskoff V, Lacaud G. Perez-Campo FM, et al. Blood. 2009 May 14;113(20):4866-74. doi: 10.1182/blood-2008-04-152017. Epub 2009 Mar 5. Blood. 2009. PMID: 19264921 Free PMC article. - Roles of the histone acetyltransferase monocytic leukemia zinc finger protein in normal and malignant hematopoiesis.
Katsumoto T, Yoshida N, Kitabayashi I. Katsumoto T, et al. Cancer Sci. 2008 Aug;99(8):1523-7. doi: 10.1111/j.1349-7006.2008.00865.x. Cancer Sci. 2008. PMID: 18754862 Free PMC article. Review. - MOZ (KAT6A) is essential for the maintenance of classically defined adult hematopoietic stem cells.
Sheikh BN, Yang Y, Schreuder J, Nilsson SK, Bilardi R, Carotta S, McRae HM, Metcalf D, Voss AK, Thomas T. Sheikh BN, et al. Blood. 2016 Nov 10;128(19):2307-2318. doi: 10.1182/blood-2015-10-676072. Epub 2016 Sep 23. Blood. 2016. PMID: 27663673 - MOZ fusion proteins in acute myeloid leukaemia.
Troke PJ, Kindle KB, Collins HM, Heery DM. Troke PJ, et al. Biochem Soc Symp. 2006;(73):23-39. doi: 10.1042/bss0730023. Biochem Soc Symp. 2006. PMID: 16626284 Review.
Cited by
- MOZ regulates B-cell progenitors and, consequently, Moz haploinsufficiency dramatically retards MYC-induced lymphoma development.
Sheikh BN, Lee SC, El-Saafin F, Vanyai HK, Hu Y, Pang SH, Grabow S, Strasser A, Nutt SL, Alexander WS, Smyth GK, Voss AK, Thomas T. Sheikh BN, et al. Blood. 2015 Mar 19;125(12):1910-21. doi: 10.1182/blood-2014-08-594655. Epub 2015 Jan 20. Blood. 2015. PMID: 25605372 Free PMC article. - Homozygous disruption of the Tip60 gene causes early embryonic lethality.
Hu Y, Fisher JB, Koprowski S, McAllister D, Kim MS, Lough J. Hu Y, et al. Dev Dyn. 2009 Nov;238(11):2912-21. doi: 10.1002/dvdy.22110. Dev Dyn. 2009. PMID: 19842187 Free PMC article. - PU.1-mediated upregulation of CSF1R is crucial for leukemia stem cell potential induced by MOZ-TIF2.
Aikawa Y, Katsumoto T, Zhang P, Shima H, Shino M, Terui K, Ito E, Ohno H, Stanley ER, Singh H, Tenen DG, Kitabayashi I. Aikawa Y, et al. Nat Med. 2010 May;16(5):580-5, 1p following 585. doi: 10.1038/nm.2122. Epub 2010 Apr 25. Nat Med. 2010. PMID: 20418886 Free PMC article. - Alcohol-induced protein hyperacetylation: mechanisms and consequences.
Shepard BD, Tuma PL. Shepard BD, et al. World J Gastroenterol. 2009 Mar 14;15(10):1219-30. doi: 10.3748/wjg.15.1219. World J Gastroenterol. 2009. PMID: 19291822 Free PMC article. Review. - Expression of the MOZ-TIF2 oncoprotein in mice represses senescence.
Largeot A, Perez-Campo FM, Marinopoulou E, Lie-a-Ling M, Kouskoff V, Lacaud G. Largeot A, et al. Exp Hematol. 2016 Apr;44(4):231-7.e4. doi: 10.1016/j.exphem.2015.12.006. Epub 2016 Feb 5. Exp Hematol. 2016. PMID: 26854485 Free PMC article.
References
- Anderson G., Hare K.J., Jenkinson E.J. Positive selection of thymocytes: The long and winding road. Immunol. Today. 1999;20:463–468. - PubMed
- Berger S.L. Histone modifications in transcriptional regulation. Curr. Opin. Genet. Dev. 2002;12:142–148. - PubMed
- Borrow J., Stanton V.J., Andresen J., Becher R., Behm F., Chaganti R., Civin C., Disteche C., Dube I., Frischauf A., et al. The translocation t(8;16)(p11;p13) of acute myeloid leukaemia fuses a putative acetyltransferase to the CREB-binding protein. Nat. Genet. 1996;14:33–41. - PubMed
- Carapeti M., Aguiar R., Goldman J., Cross N. A novel fusion between MOZ and the nuclear receptor coactivator TIF2 in acute myeloid leukemia. Blood. 1998;91:3127–3133. - PubMed
- Chaffanet M., Gressin L., Preudhomme C., Soenen-Cornu V., Birnbaum D., Pebusque M.J. MOZ is fused to p300 in an acute monocytic leukemia with t(8;22). Genes Chromosomes Cancer. 2000;28:138–144. - PubMed
Publication types
MeSH terms
Substances
LinkOut - more resources
Full Text Sources
Other Literature Sources
Medical
Molecular Biology Databases

