Genome-wide prediction of G4 DNA as regulatory motifs: role in Escherichia coli global regulation - PubMed (original) (raw)
Comparative Study
Genome-wide prediction of G4 DNA as regulatory motifs: role in Escherichia coli global regulation
Pooja Rawal et al. Genome Res. 2006 May.
Abstract
The role of nonlinear DNA in replication, recombination, and transcription has become evident in recent years. Although several studies have predicted and characterized regulatory elements at the sequence level, very few have investigated DNA structure as regulatory motifs. Here, using G-quadruplex or G4 DNA motifs as a model, we have researched the role of DNA structure in transcription on a genome-wide scale. Analyses of >61,000 open reading frames (ORFs) across 18 prokaryotes show enrichment of G4 motifs in regulatory regions and indicate its predominance within promoters of genes pertaining to transcription, secondary metabolite biosynthesis, and signal transduction. Based on this, we predict that G4 DNA may present regulatory signals. This is supported by conserved G4 motifs in promoters of orthologous genes across phylogenetically distant organisms. We hypothesized a regulatory role of G4 DNA during supercoiling stress, when duplex destabilization may result in G4 formation. This is in line with our observations from target site analysis for 55 DNA-binding proteins in Escherichia coli, which reveals significant (P<0.001) association of G4 motifs with target sites of global regulators FIS and Lrp and the sigma factor RpoD (sigma70). These factors together control >1000 genes in the early growth phase and are believed to be induced by supercoiled DNA. We also predict G4 motif-induced supercoiling sensitivity for >30 operons in E. coli, and our findings implicate G4 DNA in DNA-topology-mediated global gene regulation in E. coli.
Figures
Figure 1.
Schematic representation of G4 motif. (A) Hydrogen-bonded G-tetrad with K+ (Na+ also stabilizes a G-tetrad); each guanine in this planar array is contributed from different G-runs, which are separated by intervening loops in an intramolecular motif. (B,C) Intramolecular folding pattern showing stem and loop organization in an antiparallel (B) and parallel (C) conformation of a G4 motif, where the planes represent each tetrad unit and are stacked to form the stem of the motif.
Figure 2.
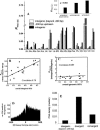
Putative regulatory regions in prokaryotes are enriched in PG4 motifs. (A) Genome-wide distribution of PG4 motifs within the + strand in 18 prokaryotes showing frequency of the bases forming PG4 motifs in each region expressed as a ratio of the GC frequency of the respective region (_R_PG4/GC) for each organism. (Inset) Median ratio (_R_PG4/GC) for each region calculated from the distribution in the respective regions across all organisms. (Supplemental Table S5 shows the mean and standard deviation, and Supplemental Fig. S3 shows a similar distribution for the − strand.) The intergenic (beyond −200 bp) region includes all intergenic regions except the downstream region between two convergently oriented genes. (B) GC-rich organisms have selected for PG4 motifs in their immediate upstream regions. Ratio of the frequency of PG4 motifs (after controlling for GC% in the respective regions) in the −100-bp region versus beyond −100 bp within the intergenic region shows a high correlation with the GC% of the intergenic region for respective organisms. (C) The motif frequency of intergenic versus intragenic regions does not depend on the GC% of the genome. The ratio-plot for intergenic versus intragenic regions against overall (genome-wide) GC% of the organism shows very low correlation. M. genitalium shows a high ratio (>5.0) because of a very low intergenic basepair length (correlation on excluding M. genitalium was 0.24). (D) The number of PG4 motifs decreases sharply on moving upstream of genes relative to the intragenic regions. Data were plotted from all 61,355 ORFs in 18 organisms within the flanking 500 bases of the start codon of all ORFs. The center of each motif sequence was used for mapping with respect to the start codon (i.e., for a sequence of length n, the n/2-th base was used as its coordinate). (E) Promoter-rich regions have a higher density of PG4 motifs. Intergenic regions separating divergently (promoter-rich) and convergently (possibly promoter-less) oriented gene pairs were mapped in all 18 organisms for comparison. The median of PG4 density (number of bases involved in motif pattern normalized for sequence length of the respective region) is shown along with the density in the intergenic regions (beyond −200 bp, as in A). The difference between the divergent and convergent (P < 0.007) and the divergent and intergenic (P < 0.025) regions was significant, while the difference between the convergent and intergenic regions was not significant (P = 0.199). All statistical comparisons were done in a pairwise mode for the different genomic regions, and significance was estimated using the two-tailed nonparametric Signed Wilcoxon Test. The organism acronyms are as obtained from KEGG and are mentioned in Methods.
Figure 3.
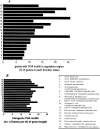
Genes harboring PG4 motifs in their regulatory region show distinct functional distribution in a comparative analysis comprising 37,974 ORFs from 18 organisms. (A) The distribution of genes with at least one PG4 motif within the −200-bp region is shown as the percentage of total genes in the respective function class—secondary metabolite biosynthesis, transcription, and translation related genes show significant difference (P < 0.004). (B) The intragenic PG4 motif density indicates that the distribution is not significantly different across the functional classes (P = 0.108). The PG4 motif density was calculated as the number of bases involved in motif formation per kilobase of gene length. Two classes, chromatin structure and dynamics and RNA processing and modification, which constitute only 0.054% and 0.09% of the distribution, were not included in the plots. Extracellular structure, nuclear structure, and cytoskeleton genes do not have any motifs in their regulatory regions. Undefined classes like function unknown and general function prediction have been excluded from analysis along with genes not found in the COGS database. All function information was obtained from the COGS database. A plot showing distribution across the functional classes with respect to the total ORFs (5574) with PG4 motifs in −200-bp regions is shown in Supplemental Figure S5.
Figure 4.
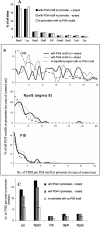
Global regulators Lrp, FIS, and GlpR and sigma factors σ70 and σS are predominantly associated with PG4 motifs in Escherichia coli. We computationally mapped target sites for 55 DNA-binding proteins in the region flanking (100 bp) PG4 motifs present within −200 bp of start codons in the + strand (118 motifs) and − strand (96 motifs). Sites were also mapped to 445 promoter regions (within −200 bp of start codon) devoid of PG4 motifs as a control set. (A) Overall representation of sites (for nine factors with >1% sites) as a percentage of total sites for 55 DNA-binding proteins is shown for the respective regions. (B) Frequency distribution of TFBS. Motifs or promoters (%) were plotted against the number of sites found either flanking the motifs or within the promoter (in case of control set); representative plots for three factors are shown (for others, see Supplemental Fig. S6). Distributions were observed to be significantly (P < 0.001) different for Lrp, RpoD, FIS, RpoS, and GlpR when compared between the + or − strand and the control set, while SoxS, TyrR, Crp, and OmpR did not show a statistically significant difference (_P_ > 0.05). (C) Target sites (median) per motif (+/− strand) or promoter (control set) are shown for five factors with significantly different distribution. Nonparametric comparisons were done using the Mann-Whitney U-test; the _P_-values for respective comparisons are shown in Supplemental Table S8.
Similar articles
- G-quadruplex forming structural motifs in the genome of Deinococcus radiodurans and their regulatory roles in promoter functions.
Kota S, Dhamodharan V, Pradeepkumar PI, Misra HS. Kota S, et al. Appl Microbiol Biotechnol. 2015 Nov;99(22):9761-9. doi: 10.1007/s00253-015-6808-6. Epub 2015 Jul 23. Appl Microbiol Biotechnol. 2015. PMID: 26201493 - The genome-wide distribution of non-B DNA motifs is shaped by operon structure and suggests the transcriptional importance of non-B DNA structures in Escherichia coli.
Du X, Wojtowicz D, Bowers AA, Levens D, Benham CJ, Przytycka TM. Du X, et al. Nucleic Acids Res. 2013 Jul;41(12):5965-77. doi: 10.1093/nar/gkt308. Epub 2013 Apr 25. Nucleic Acids Res. 2013. PMID: 23620297 Free PMC article. - G-quadruplex prediction in E. coli genome reveals a conserved putative G-quadruplex-Hairpin-Duplex switch.
Kaplan OI, Berber B, Hekim N, Doluca O. Kaplan OI, et al. Nucleic Acids Res. 2016 Nov 2;44(19):9083-9095. doi: 10.1093/nar/gkw769. Epub 2016 Sep 4. Nucleic Acids Res. 2016. PMID: 27596596 Free PMC article. - G-Quadruplex Structures in Bacteria: Biological Relevance and Potential as an Antimicrobial Target.
Yadav P, Kim N, Kumari M, Verma S, Sharma TK, Yadav V, Kumar A. Yadav P, et al. J Bacteriol. 2021 Jun 8;203(13):e0057720. doi: 10.1128/JB.00577-20. Epub 2021 Jun 8. J Bacteriol. 2021. PMID: 33649149 Free PMC article. Review.
Cited by
- Bisquinolinium compounds induce quadruplex-specific transcriptome changes in HeLa S3 cell lines.
Halder R, Riou JF, Teulade-Fichou MP, Frickey T, Hartig JS. Halder R, et al. BMC Res Notes. 2012 Mar 13;5:138. doi: 10.1186/1756-0500-5-138. BMC Res Notes. 2012. PMID: 22414013 Free PMC article. - Genome-wide study predicts promoter-G4 DNA motifs regulate selective functions in bacteria: radioresistance of D. radiodurans involves G4 DNA-mediated regulation.
Beaume N, Pathak R, Yadav VK, Kota S, Misra HS, Gautam HK, Chowdhury S. Beaume N, et al. Nucleic Acids Res. 2013 Jan 7;41(1):76-89. doi: 10.1093/nar/gks1071. Epub 2012 Nov 17. Nucleic Acids Res. 2013. PMID: 23161683 Free PMC article. - Role of Hfq in Genome Evolution: Instability of G-Quadruplex Sequences in E. coli.
Parekh VJ, Niccum BA, Shah R, Rivera MA, Novak MJ, Geinguenaud F, Wien F, Arluison V, Sinden RR. Parekh VJ, et al. Microorganisms. 2019 Dec 22;8(1):28. doi: 10.3390/microorganisms8010028. Microorganisms. 2019. PMID: 31877879 Free PMC article. - Genome-Wide Analysis of Putative G-Quadruplex Sequences (PGQSs) in Onion Yellows Phytoplasma (Strain OY-M): An Emerging Plant Pathogenic Bacteria.
Singh A, Lakhanpaul S. Singh A, et al. Indian J Microbiol. 2019 Dec;59(4):468-475. doi: 10.1007/s12088-019-00831-z. Epub 2019 Oct 8. Indian J Microbiol. 2019. PMID: 31762510 Free PMC article. - Structured Waters Mediate Small Molecule Binding to G-Quadruplex Nucleic Acids.
Neidle S. Neidle S. Pharmaceuticals (Basel). 2021 Dec 22;15(1):7. doi: 10.3390/ph15010007. Pharmaceuticals (Basel). 2021. PMID: 35056064 Free PMC article.
References
- Arimondo P.B., Riou J.F., Mergny J.L., Tazi J., Sun J.S., Garestier T., Helene C., Riou J.F., Mergny J.L., Tazi J., Sun J.S., Garestier T., Helene C., Mergny J.L., Tazi J., Sun J.S., Garestier T., Helene C., Tazi J., Sun J.S., Garestier T., Helene C., Sun J.S., Garestier T., Helene C., Garestier T., Helene C., Helene C. Interaction of human DNA topoisomerase I with G-quartet structures. Nucleic Acids Res. 2000;28:4832–4838. - PMC - PubMed
- Bacolla A., Wells R.D., Wells R.D. Non-B DNA conformations, genomic rearrangements, and human disease. J. Biol. Chem. 2004;279:47411–47414. - PubMed
- Balagurumoorthy P., Brahmachari S.K., Brahmachari S.K. Structure and stability of human telomeric sequence. J. Biol. Chem. 1994;269:21858–21869. - PubMed
Publication types
MeSH terms
Substances
LinkOut - more resources
Full Text Sources
Other Literature Sources
Miscellaneous


