A large field CCD system for quantitative imaging of microarrays - PubMed (original) (raw)
A large field CCD system for quantitative imaging of microarrays
G Hamilton et al. Nucleic Acids Res. 2006.
Abstract
We describe a charge-coupled device (CCD) imaging system for microarrays capable of acquiring quantitative, high dynamic range images of very large fields. Illumination is supplied by an arc lamp, and filters are used to define excitation and emission bands. The system is linear down to fluorochrome densities <<1 molecule/microm2. The ratios of the illumination intensity distributions for all excitation wavelengths have a maximum deviation approximately +/-4% over the object field, so that images can be analyzed without computational corrections for the illumination pattern unless higher accuracy is desired. Custom designed detection optics produce achromatic images of the spectral region from approximately 450 to approximately 750 nm. Acquisition of a series of images of multiple fluorochromes from multiple arrays occurs under computer control. The version of the system described in detail provides images of 20 mm square areas using a 27 mm square, 2K x 2K pixel, cooled CCD chip with a well depth of approximately 10(5) electrons, and provides ratio measurements accurate to a few percent over a dynamic range in intensity >1000. Resolution referred to the sample is 10 microm, sufficient for obtaining quantitative multicolor images from >30,000 array elements in an 18 mm x 18 mm square.
Figures
Figure 1
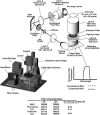
Overview of the optical design. The major optical components of the instrument are shown in the sketch and their function is described in the text. The actual configuration of the system is shown in the CAD picture, including the light tight enclosure and the motorized stage for array transport. The drawing of the band pass of a representative emission filter shows the shape of the transmission curve of a normal interference filter, and for the compound filters used in this instrument which also contain a layer of absorbing glass to block transmission of scattered light that may be incident on the filter at large angles from the normal. The characteristics of the excitation and emission filters are listed in the table, as are representative intensities of the excitation light.
Figure 2
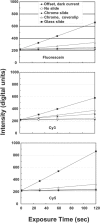
System offset and background light levels as a function of exposure time for various measurement conditions. Intensity at the center of the image as a function of exposure time is shown for the system when no array is present, and for a bare chromium substrate, a chromium substrate plus coverslip and a glass slide. In addition the camera output with the excitation light off is also shown to demonstrate the camera offset and dark current. The key to identify the various curves is located in the upper graph, which shows backgrounds for the fluorescein filter set. The middle and lower graphs provide similar information for the Cy3 and Cy5 filter sets, respectively. The data show that the camera offset is ∼220 U, and that the dark current of the camera is negligible over these integration times. These curves allow estimation of the background light levels due to the array substrate and mounting components. For example, typical integration times for our measurements are 20–40 s for Cy3 and Cy5, which result would result background contributions of 20–50 digital units for the chrome slide plus coverslip in an actual array measurement. Background for the standard glass slides are much higher, and are variable among batches of slides perhaps due to trace differences in their compositions. Total backgrounds in real array measurements will be higher than in this figure due to non-specific binding during the hybridization. Figure 9 shows the effect backgrounds on measurement precision.
Figure 3
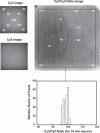
Illumination distributions over the object field. Images of fluorescence from a smoky gray translucent plastic test sheet were obtained using the Cy3 and Cy5 filter sets. The intensity pattern in the image directly indicates the illumination pattern because the detection optics provide essentially uniformity of the sensitivity over the field. At the left, images of the full-field illuminations for Cy3 and Cy5 are shown, with the relative intensities at representative locations in the field indicated. The intensities are highest in the center, and drop to ∼60% of the central value at the corners of the 18 mm area used for array imaging. The dark areas at upper left and upper right corners of the images are due to obstruction of the light path by the boundaries of the open camera shutter. The (linear) ratio of these two images, smoothed using a median filter with a radius approximately the size of an array element (3 pixels) and contrast-stretched so that 1% changes result in a change in gray level, is shown to the right. Relative (linear) ratio values for the various gray levels are indicated on the image within a black boundary that indicates the area of an 18 mm square array. A histogram, bottom, of the intensity values within the 18 mm square shows that the full range of this distribution is ±4%, with most of the image within ±3%.
Figure 4
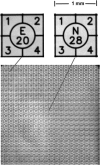
Resolution across entire image. Full-frame image of an England Finder slide consisting of etched 1 mm squares on a thick glass substrate. The image was obtained using the Cy5 filter set. The excitation light produced fluorescence in the glass substrate, which back-illuminate the etched pattern on the upper surface. Enlarged images of two of these squares, one at the center and one at a corner of the image are shown, indicating that the focus is maintained across the entire field. The full-field encompasses approximately a 20 mm square, which given the 2K × 2K pixels, calibrates the pixelization as 10 µm/pixel.
Figure 5
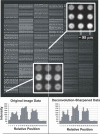
DAPI image of ∼30 000 element test array. DNA was printed from 864-well microtiter plates (3 mm well spacing) using our custom-built array printer (S. Clark, G. Hamilton, N. Brown, V. Oseroff, R. Nordmeyer, D. Albertson, D. Pinkel, manuscript in preparation). Large numbers of replicate spots were printed for each solution, leading to the stripped appearance which represents differences in the DNA concentrations in the printing solutions. The elements are printed on ∼95 µm centers. Expanded views of the image from a region at the center and in the lower left corner show the elements are well resolved. The printing pin used at the center of the array produced spots of ∼60 µm diameter, while that at the lower left made elements with a diameter of ∼70 µm. Pixel intensities are shown for a vertical line through three spots in the lower left corner for the original image data, and after deconvolution sharpening of the image. The signal level between the elements is due to a combination of camera offset, ∼220 U, fluorescence from free DAPI in the mounting medium, and slight softness in the image. The softness is seen by the slight elevation of the intensities in the troughs between array elements compared with the intensity in the image outside of the area of the array (pixels 33–39 in this plot). Intensities along diagonal lines connecting the elements fall fully to ‘background’ levels (data not shown). Deconvolution image sharpening (using a Wiener filter implemented in MATLAB) deepens the troughs to the same level as the region outside the array and improves the resolution of features of spot morphology.
Figure 6
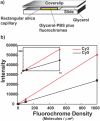
Detection sensitivity. (a) Glycerol-PBS solutions containing known concentrations of Cy3 and Cy5 were loaded into rectangular fused silica capillaries, placed on a chromium-coated microscope slide, surrounded by glycerol and a glass cover slip applied. This mounting closely matched the indices of refraction of capillaries (fused silica ∼1.459, glycerol ∼1.473) so that very little light scatter was generated at the capillary surfaces. Five capillaries were mounted in an image field, each containing a mixture of Cy3 and Cy5 at concentrations of 0, 1, 10, 100 and 1000 molecules/µm2, and Cy3 and Cy5 images acquired. Concentrations of stock solutions were determined using absorbance measurements and known extinction coefficients. (b) Fluorescence intensities Cy3 (red curve) and Cy5 (black curve) increased linearly with fluorochrome density. The inset shows the portion of the curves between 0 and 10 fluorochromes/µm2, indicting the ability to detect concentrations below 1 fluorochrome/µm2.
Figure 7
(a) Array CGH comparison of genomic DNA from a normal female to a normal male using a microarray containing BAC clones mapped to ∼2500 loci distributed across the genome. Each point represents the average value of M = Log2(ratio) for the triplicate array elements for each locus, plotted according to its order in the genome. The elevated points to the right are X chromosome loci, and the low points at the very far right are on the Y chromosome. No computational corrections to the images or data, other than an overall normalization so that the median value of M = 0, were applied to the images or the data. Exposure times for the Cy3 and Cy5 images are indicated. (b) ‘M versus A_’ plots for all 7500 elements on the array for images acquired with different exposure times. ‘_A_’ is a combined measure of the Test and Reference intensities as indicated on the plot. Blue points indicate data from the images used for (a), which were obtained with our ‘standard’ exposure times. The points above the main band correspond to X chromosome loci, while the few falling below map to loci on the Y. Small clusters of three points can be seen, which are produced by the triplicate elements for each locus. Points in red and green show the results when exposures of the Cy3 or Cy5 have been increased by a factor of 3. Exposure times are shown with a color code to match the data points. The locations of the data points move by exactly the amount expected, Δ_M = Log2(3) = 1.58, ΔA = 0.5Log2(3) = 0.79, as indicated on the plot. Note that the plots for the different exposure times have the same distribution of points to very high accuracy, as can be seen, for example, by the reproducibility of the relative positions of the measurements of loci that fall outside the main cloud. Independent sets of Cy3 and Cy5 images were obtained for each analysis. The data points represent background-corrected intensities obtained directly from the images without computational adjustment or overall normalization.
Figure 8
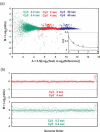
Dependence of measurement precision on signal intensity. (a) M versus A as a function of reduced exposure times. Data from three sets of exposure times, our standard and two steps of 10-fold reduction of both Cy3 and Cy5, are shown for the same array as in Figure 7. Each point represents one element (∼7500 total) on the array, its color matching the exposure times shown at the top of the figure. Within each exposure the intensities of the elements range over 4 U in A as in Figure 7, and between exposures they decrease by exactly the expected factor of 10. Careful examination of the points that are individually distinguishable in the two highest exposure times show that they have nearly identical relative locations, indicating very low random noise in the entire analytical process. However, broadening in M is clearly seen at the lowest exposure for those elements on the array where the intensity is <A = 5–6. No computational adjustments have been made to these data. The inset shows the standard deviation of the Log2Ratio, (standard deviation of M), as a function of A. The points were obtained from an analysis of the data in the main figure, and the line is based on a model that includes photon counting statistics and camera readout noise as the only sources of random variation in the measurement (Supplementary Data). The calculation indicates that camera readout noise makes the dominant contribution to the measurement uncertainty because the array elements are large enough so that their total light emission is sufficient to make photoelectron shot noise less important until even lower intensities. Note that in these measurements the background intensity is effectively zero, since it is reduced proportionally to the signals as the exposure times are reduced. Thus they do not accurately simulate an actual measurement situation. An enlarged view of this inset, including additional curves modeling the effects of constant background levels as well as very small array elements, is shown in Figure 9. (b) Copy number profiles for the data from the two lowest exposures. The profile (red points) is very similar to that of Figure 7a, which was obtained with a 10-fold higher exposure time. The profile for the lowest exposure clearly shows broadening, and many points have been removed by quality control filtering. Even so, the basic copy number features are clearly present with exposures that are 100-fold lower than ‘standard’.
Figure 9
Estimation of ratio measurement precision for different conditions. The closed square boxes indicate measured values of the standard deviation of the Log2(ratio) as a function of Log2(intensity), A, from the data in Figure 8a. The ‘intrinsic’ variation in this array, as determined by the standard deviation measured at high intensity, is 0.06. The solid black line shows the behavior of the model calculation using the camera and array parameters appropriate for these measurements. The data points and predicted behavior are also shown in the inset of Figure 8a. In these measurements the background intensity is effectively 0, since it is reduced proportionally to the signals as the exposure times are reduced to get the low intensity signals. This is not an accurate simulation of a true measurement because detection of truly weak signals requires longer exposures and their concomitant higher backgrounds. The black dotted lines indicate the expected measurement precision for background light levels of 50, 500 and 3000 digital units. For typical exposures one expects minimum backgrounds of ∼ 50–100 based on the data in Figure 2. Thus when the signal intensities are ∼62 digital units (A = 6) above the background, the measurements approach 0.06, the ‘intrinsic’ variation in the array in this simulation. The solid red line simulates the expected measurement resolution for an array in which all of the light from an array element is collected in one pixel, background is determined from 15 nearby pixels, and the background level is 50 digital units. The standard deviation of the Log2ratios is predicted to be <0.1 for intensities >∼300 digital units above background.
Similar articles
- A high-resolution multimode digital microscope system.
Salmon ED, Shaw SL, Waters JC, Waterman-Storer CM, Maddox PS, Yeh E, Bloom K. Salmon ED, et al. Methods Cell Biol. 2013;114:179-210. doi: 10.1016/B978-0-12-407761-4.00009-9. Methods Cell Biol. 2013. PMID: 23931508 - 3D restoration with multiple images acquired by a modified conventional microscope.
Vermolen BJ, Garini Y, Young IT. Vermolen BJ, et al. Microsc Res Tech. 2004 Jun 1;64(2):113-25. doi: 10.1002/jemt.20072. Microsc Res Tech. 2004. PMID: 15352082 - DNASER I: layout and data analysis.
Nicolini C, Malvezzi AM, Tomaselli A, Sposito D, Tropiano G, Borgogno E. Nicolini C, et al. IEEE Trans Nanobioscience. 2002 Jun;1(2):67-72. doi: 10.1109/tnb.2002.806941. IEEE Trans Nanobioscience. 2002. PMID: 16689209 - A unique charge-coupled device/xenon arc lamp based imaging system for the accurate detection and quantitation of multicolour fluorescence.
Spibey CA, Jackson P, Herick K. Spibey CA, et al. Electrophoresis. 2001 Mar;22(5):829-36. doi: 10.1002/1522-2683()22:5<829::AID-ELPS829>3.0.CO;2-U. Electrophoresis. 2001. PMID: 11332749 Review. - Illumination, wavelength selection, and detection in fluorescence microscopy.
Spring KR. Spring KR. Kidney Int Suppl. 1991 Jul;33:S18-22. Kidney Int Suppl. 1991. PMID: 1890798 Review.
Cited by
- Isolation and genomic analysis of circulating tumor cells from castration resistant metastatic prostate cancer.
Magbanua MJ, Sosa EV, Scott JH, Simko J, Collins C, Pinkel D, Ryan CJ, Park JW. Magbanua MJ, et al. BMC Cancer. 2012 Feb 28;12:78. doi: 10.1186/1471-2407-12-78. BMC Cancer. 2012. PMID: 22373240 Free PMC article. - Mapping of deletion and translocation breakpoints in 1q44 implicates the serine/threonine kinase AKT3 in postnatal microcephaly and agenesis of the corpus callosum.
Boland E, Clayton-Smith J, Woo VG, McKee S, Manson FD, Medne L, Zackai E, Swanson EA, Fitzpatrick D, Millen KJ, Sherr EH, Dobyns WB, Black GC. Boland E, et al. Am J Hum Genet. 2007 Aug;81(2):292-303. doi: 10.1086/519999. Epub 2007 Jun 13. Am J Hum Genet. 2007. PMID: 17668379 Free PMC article. - Microarray analyzer based on wide field fluorescent microscopy with laser illumination and a device for speckle suppression.
Lysov Y, Barsky V, Urasov D, Urasov R, Cherepanov A, Mamaev D, Yegorov Y, Chudinov A, Surzhikov S, Rubina A, Smoldovskaya O, Zasedatelev A. Lysov Y, et al. Biomed Opt Express. 2017 Oct 3;8(11):4798-4810. doi: 10.1364/BOE.8.004798. eCollection 2017 Nov 1. Biomed Opt Express. 2017. PMID: 29188082 Free PMC article. - Development of a fluorescence-based, ultra high-throughput screening platform for nanoliter-scale cytochrome p450 microarrays.
Sukumaran SM, Potsaid B, Lee MY, Clark DS, Dordick JS. Sukumaran SM, et al. J Biomol Screen. 2009 Jul;14(6):668-78. doi: 10.1177/1087057109336592. Epub 2009 Jun 12. J Biomol Screen. 2009. PMID: 19525490 Free PMC article. - Optical detection of nanoparticle-enhanced human papillomavirus genotyping microarrays.
Li XZ, Kim S, Cho W, Lee SY. Li XZ, et al. Biomed Opt Express. 2013 Feb 1;4(2):187-92. doi: 10.1364/BOE.4.000187. Epub 2012 Dec 20. Biomed Opt Express. 2013. PMID: 23413051 Free PMC article.
References
- Che D., Bao Y., Muller U.R. Novel surface and multicolor charge coupled device-based fluorescent imaging system for DNA microarrays. J. Biomed. Opt. 2001;6:450–456. - PubMed
- Snijders A.M., Nowak N., Segraves R., Blackwood S., Brown N., Conroy J., Hamilton G., Hindle A.K., Huey B., Kimura K., et al. Assembly of microarrays for genome-wide measurement of DNA copy number. Nature Genet. 2001;29:263–264. - PubMed
- Pinkel D., Segraves R., Sudar D., Clark S., Poole I., Kowbel D., Collins C., Kuo W.L., Chen C., Zhai Y., et al. High resolution analysis of DNA copy number variation using comparative genomic hybridization to microarrays. Nature Genet. 1998;20:207–211. - PubMed
- Shingyoji M., Gerion D., Pinkel D., Gray J.W., Chen F. Quantum dots-based reverse phase protein microarray. Talanta. 2005;67:472–478. - PubMed
Publication types
MeSH terms
Substances
LinkOut - more resources
Full Text Sources
Other Literature Sources
