Statistical neuroanatomy of the human inferior frontal gyrus and probabilistic atlas in a standard stereotaxic space - PubMed (original) (raw)
Statistical neuroanatomy of the human inferior frontal gyrus and probabilistic atlas in a standard stereotaxic space
Alexander Hammers et al. Hum Brain Mapp. 2007 Jan.
Abstract
We manually defined the inferior frontal gyrus (IFG) on high-resolution MRIs in native space in 30 healthy subjects (15 female, median age 31 years; 15 male, median age 30 years), resulting in 30 individual atlases. Using standard software (SPM99), these were spatially transformed to a widely used stereotaxic space (MNI/ICBM 152) to create probabilistic maps. In native space, the total IFG volume was on average 5%, and the gray matter (GM) portion 12% larger in women (not significant). Expressed as a percentage of ipsilateral frontal lobe volume (i.e., correcting for brain size), the IFG was an average of 20%, and the GM portion of the IFG 27%, larger in women (P < 0.005). Correcting for total lobar volume yielded the same result. No asymmetry was found in IFG volumes. There were significant positional differences between the right and left IFGs, with the right IFG being further lateral in both native and stereotaxic space. Variability was similar on the left and right, but more pronounced anteriorly and superiorly. We show differences in IFG volume, composition, and position between sexes and between hemispheres. Applications include probabilistic determination of location in group studies, automatic labeling of new scans, and detection of anatomical abnormalities in patients.
Figures
Figure 1
Example of a 3‐D rendering of one of the 30 maps of the IFG, introducing the nomenclature and landmarks used. Relevant sulci are indicated with white arrows and the subdivisions of the IFG in yellow. The IFG is rendered in red and the precentral gyrus in blue.
Figure 2
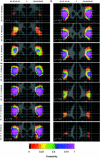
Probability shells in standard stereotaxic space for the IFG in coronal orientation, overlaid onto the ICBM/MNI average brain constructed from 152 healthy volunteers resampled into a 1 × 1 × 1 mm matrix. The grid spacing is 10 mm, with bolder lines indicating the origin as defined in the ICBM/MNI template (∼2.5 mm posterior and 6 mm superior of the middle of the anterior commissure; see also
http://www.mrc-cbu.cam.ac.uk/Imaging/Common/antcomm.shtml
). Left on the image is left in the brain. The _x_‐axis increases from left to right, y from posterior to anterior, and z from inferior to superior. The probability shells are sampled every 4 mm. The color code indicates probability of a given voxel pertaining to the IFG.
Figure 3
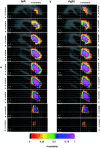
Probability shells in standard stereotaxic space for the IFG in sagittal orientation. For further explanations, see legend for Figure 3.
Figure 4
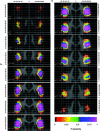
Probability shells in standard stereotaxic space for the IFG in transverse orientation. For further explanations, see legend for Figure 3.
Figure 5
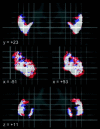
Probability shells in standard stereotaxic space for the GM contribution to the IFG, separately thresholded at 50% probability for men and women. Red: womens' 50% probability map larger; blue: mens' 50% probability map larger; white: common areas. Top: coronal; middle: sagittal; bottom: transverse. Position in mm relative to AC as defined in MNI/ICBM152 space; left on the image is left in the brain.
Figure 6
Comparison of probability maps in coronal orientation. Position in mm relative to AC as defined in MNI/ICBM152 space. Left on the image is left in the brain. Left side, cytoarchitectonic probability maps of Brodmann's area 44 based on 10 postmortem brains [Amunts et al.,1999] from the Forschungszentrum Jülich that have been spatially normalized to a single subject brain (an approximation of MNI/ICBM152 space) [Holmes et al.,1998], downloaded from
http://www.bic.mni.mcgill.ca/cytoarchitectonics
. For comparison, the color scale has been changed to match Figures 3, 4, 5. Right side, probability maps for GM contribution only based on all 30 brains in the current study. For comparison, the probability maps are here superimposed on the single subject brain.
Figure 1
Delineation of the IFG on reoriented images in native space. Regions other than IFG are shown (nomenclature as in Hammers et al. [2003a, 2003b]; left IFG: 56; right IFG: 57; regions surrounding the IFG are: 51: precentral gyrus; 20/21: left/right insula; 28: frontal lobe prior to further subdivision). A: Sagittal marker slice; left side: marker as it appears on sagittal image (arrow) and connection of inferior frontal sulcus with precentral sulcus (*); right side: marker as it appears on the coronal image in aid of delineation (arrow). B: Anterior part of IFG. Line from the deepest point of the inferior frontal sulcus (upper arrow) to the deepest point of the frontomarginal sulcus/lateral orbital sulcus (lower arrow). At this point, the horizontal ramus of the lateral fissure is not visible. C: Inclusion of the horizontal ramus of the lateral fissure (left arrow) when this extends more medial than the connection between the deepest point of the inferior frontal sulcus to the deepest point of the frontomarginal sulcus/lateral orbital sulcus. On the right, the corresponding position on a 3‐D‐rendered scan is shown; the blue portion corresponds to the section of IFG defined starting anteriorly. D: The lateral orbital sulcus lies inferiorly to the widening horizontal ramus of the lateral fissure; therefore, tissue superior to and inferior to the fissure leading to the insula (arrow) is included. For further explanation, see “Algorithm for IFG Definition” in Materials and Methods.
Similar articles
- Three-dimensional maximum probability atlas of the human brain, with particular reference to the temporal lobe.
Hammers A, Allom R, Koepp MJ, Free SL, Myers R, Lemieux L, Mitchell TN, Brooks DJ, Duncan JS. Hammers A, et al. Hum Brain Mapp. 2003 Aug;19(4):224-47. doi: 10.1002/hbm.10123. Hum Brain Mapp. 2003. PMID: 12874777 Free PMC article. - Gyri of the human parietal lobe: Volumes, spatial extents, automatic labelling, and probabilistic atlases.
Wild HM, Heckemann RA, Studholme C, Hammers A. Wild HM, et al. PLoS One. 2017 Aug 28;12(8):e0180866. doi: 10.1371/journal.pone.0180866. eCollection 2017. PLoS One. 2017. PMID: 28846692 Free PMC article. - Three-dimensional probabilistic maps of the occipital sulci of the human brain in standardized stereotaxic space.
Iaria G, Robbins S, Petrides M. Iaria G, et al. Neuroscience. 2008 Jan 2;151(1):174-85. doi: 10.1016/j.neuroscience.2007.09.050. Epub 2007 Nov 28. Neuroscience. 2008. PMID: 18054173 - Brain templates and atlases.
Evans AC, Janke AL, Collins DL, Baillet S. Evans AC, et al. Neuroimage. 2012 Aug 15;62(2):911-22. doi: 10.1016/j.neuroimage.2012.01.024. Epub 2012 Jan 10. Neuroimage. 2012. PMID: 22248580 Review. - Working memory and the functional anatomy of the frontal lobes.
Scheibel RS, Levin HS. Scheibel RS, et al. Cortex. 2004 Feb;40(1):218-9. doi: 10.1016/s0010-9452(08)70957-2. Cortex. 2004. PMID: 15070013 Review. No abstract available.
Cited by
- Cerebral Blood Flow in Patients with Severe Aortic Valve Stenosis Undergoing Transcatheter Aortic Valve Implantation.
Vlastra W, van Nieuwkerk AC, Bronzwaer AGT, Versteeg A, Bron EE, Niessen WJ, Mutsaerts HJMM, van der Ster BJP, Majoie CBLM, Biessels GJ, Nederveen AJ, Daemen MJAP, van Osch MJP, Baan J, Piek JJ, Van Lieshout JJ, Delewi R. Vlastra W, et al. J Am Geriatr Soc. 2021 Feb;69(2):494-499. doi: 10.1111/jgs.16882. Epub 2020 Oct 17. J Am Geriatr Soc. 2021. PMID: 33068017 Free PMC article. - Evaluation of in vivo staging of amyloid deposition in cognitively unimpaired elderly aged 78-94.
Michalowska MM, Herholz K, Hinz R, Amadi C, McInnes L, Anton-Rodriguez JM, Karikari TK, Blennow K, Zetterberg H, Ashton NJ, Pendleton N, Carter SF. Michalowska MM, et al. Mol Psychiatry. 2022 Oct;27(10):4335-4342. doi: 10.1038/s41380-022-01685-6. Epub 2022 Jul 20. Mol Psychiatry. 2022. PMID: 35858992 Free PMC article. - Assessing age-related gray matter decline with voxel-based morphometry depends significantly on segmentation and normalization procedures.
Callaert DV, Ribbens A, Maes F, Swinnen SP, Wenderoth N. Callaert DV, et al. Front Aging Neurosci. 2014 Jun 23;6:124. doi: 10.3389/fnagi.2014.00124. eCollection 2014. Front Aging Neurosci. 2014. PMID: 25002845 Free PMC article. - Sulcal variability, stereological measurement and asymmetry of Broca's area on MR images.
Keller SS, Highley JR, Garcia-Finana M, Sluming V, Rezaie R, Roberts N. Keller SS, et al. J Anat. 2007 Oct;211(4):534-55. doi: 10.1111/j.1469-7580.2007.00793.x. Epub 2007 Aug 29. J Anat. 2007. PMID: 17727624 Free PMC article. - A European multicentre PET study of fibrillar amyloid in Alzheimer's disease.
Nordberg A, Carter SF, Rinne J, Drzezga A, Brooks DJ, Vandenberghe R, Perani D, Forsberg A, Långström B, Scheinin N, Karrasch M, Någren K, Grimmer T, Miederer I, Edison P, Okello A, Van Laere K, Nelissen N, Vandenbulcke M, Garibotto V, Almkvist O, Kalbe E, Hinz R, Herholz K. Nordberg A, et al. Eur J Nucl Med Mol Imaging. 2013 Jan;40(1):104-14. doi: 10.1007/s00259-012-2237-2. Epub 2012 Sep 8. Eur J Nucl Med Mol Imaging. 2013. PMID: 22961445 Free PMC article.
References
- Amunts K, Schleicher A, Burgel U, Mohlberg H, Uylings HB, Zilles K ( 1999): Broca's region revisited: cytoarchitecture and intersubject variability. J Comp Neurol 412: 319–341. - PubMed
- Amunts K, Malikovic A, Mohlberg H, Schormann T, Zilles K ( 2000): Brodmann's areas 17 and 18 brought into stereotaxic space — where and how variable? Neuroimage 11: 66–84. - PubMed
- Amunts K, Schleicher A, Zilles K, Weiss PH, Mohlberg H, Pieperhoff P, Eickhoff S, Gurd JM, Marshall JC, Shah NJ ( 2004a): Outstanding language competence and cytoarchitecture in Broca's speech region. Brain Lang 89: 346–353. - PubMed
- Amunts K, Weiss PH, Mohlberg H, Pieperhoff P, Eickhoff S, Gurd JM, Marshall JC, Shah NJ, Fink GR, Zilles K ( 2004b): Analysis of neural mechanisms underlying verbal fluency in cytoarchitectonically defined stereotaxic space—the roles of Brodmann areas 44 and 45. Neuroimage 22: 42–56. - PubMed
- Ashburner J, Friston KJ ( 1997): Multimodal image coregistration and partitioning — a unified framework. Neuroimage 6: 209–217. - PubMed
Publication types
MeSH terms
LinkOut - more resources
Full Text Sources
Medical


