Cellular analyses of the mitotic region in the Caenorhabditis elegans adult germ line - PubMed (original) (raw)
Cellular analyses of the mitotic region in the Caenorhabditis elegans adult germ line
Sarah L Crittenden et al. Mol Biol Cell. 2006 Jul.
Abstract
The Caenorhabditis elegans germ line provides a model for understanding how signaling from a stem cell niche promotes continued mitotic divisions at the expense of differentiation. Here we report cellular analyses designed to identify germline stem cells within the germline mitotic region of adult hermaphrodites. Our results support several conclusions. First, all germ cells within the mitotic region are actively cycling, as visualized by bromodeoxyuridine (BrdU) labeling. No quiescent cells were found. Second, germ cells in the mitotic region lose BrdU label uniformly, either by movement of labeled cells into the meiotic region or by dilution, probably due to replication. No label-retaining cells were found in the mitotic region. Third, the distal tip cell niche extends processes that nearly encircle adjacent germ cells, a phenomenon that is likely to anchor the distal-most germ cells within the niche. Fourth, germline mitoses are not oriented reproducibly, even within the immediate confines of the niche. We propose that germ cells in the distal-most rows of the mitotic region serve as stem cells and more proximal germ cells embark on the path to differentiation. We also propose that C. elegans adult germline stem cells are maintained by proximity to the niche rather than by programmed asymmetric divisions.
Figures
Figure 1.
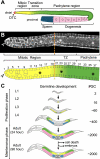
Background on C. elegans hermaphrodite germ line. (A) Schematic of adult hermaphrodite germ line. Somatic DTC, red; mitotic region, yellow; pachytene region, green; oocytes, pink; sperm, blue. Somatic tissues other than DTC are omitted for simplicity. (B) The adult mitotic region (MR). Above, extruded gonad stained with actin antibodies to outline “cell” boundaries. Below, diagram of actin-stained gonad, color-coded as in A. Transition zone, TZ. The germline MR extends from the distal end (arrowhead) to the distal edge of the transition zone (dashed line). Most germ “cells” are located peripherally and are connected by a cytoplasmic bridge to a cytoplasmic core running the length of the germline tissue (asterisk; Hirsh et al., 1976); the germ cells are technically part of a syncytium, but are referred to as “cells” because they are partially enclosed by membranes and because mitoses are not synchronized. Germ cell position is determined by counting cell diameters along the distal-proximal axis (D/P axis, numbers shown above lower diagram). The transition zone is dominated by meiotic prophase nuclei (Crittenden et al., 1994; Dernburg et al., 1998; Hansen et al., 2004a). We define the boundary between the MR and TZ by the point at which multiple germ cells acquire the crescent-shaped DAPI staining within their nuclei that is typical of early meiotic prophase (Eckmann et al., 2004). (C) Postembryonic germline development. Animals are outlined in gray; color coding as in A. L1–L4, first to fourth larval stage. Adult (24 or 96 h), adult 24 or 96 h past mid-L4; #GC, total number of germ cells. Approximate germ cell number for each developmental stage is listed at right.
Figure 2.
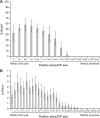
S- and M-phase indices scored in hermaphrodites 24 h past L4. Solid line indicates region of mitotic cell cycle in all germ lines. Dotted line spans positions of MR/TZ boundaries in all germ lines scored. Dashed line indicates region of meiotic prophase in all germ lines. (A) Labeling-index. % BrdU-positive cells at positions along the distal-proximal axis. Animals were fed BrdU for 15 min with no chase. Bars, 95% confidence limit. Data from 12 germ lines. (B) Mitotic index. Percent PH3+ cells at positions along the distal-proximal axis. Data from 102 germ lines.
Figure 3.
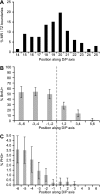
Labeling and mitotic indices normalized to MR/TZ boundary from data sets in Figure 2. (A) Percent germ lines with MR/TZ boundary at a given position. (B and C) Labeling index and mitotic index were calculated with respect to the first row of the transition zone instead of distance from the DTC. Rows in transition zone and proximal end are labeled 1, 2, etc., where the first row of the transition zone is 1. Rows distal to transition zone are labeled -1, -2 etc. (B) Labeling index normalized to MR/TZ boundary. (C) Mitotic index normalized to MR/TZ boundary. Data from 66 germ lines.
Figure 4.
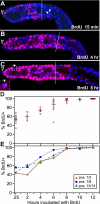
Active cycling in the mitotic region. (A–C) Single confocal sections of germ lines extruded after BrdU pulses of increasing times. Pink, anti-BrdU; blue, TO-PRO-3 DNA dye; dashed line, mitotic region/transition zone boundary, arrowheads, distal end. (A) 15-min BrdU pulse. BrdU labels nuclei in both mitotic region left of dashed line and transition zone to its right. Nuclei with crescent-shaped DAPI staining are BrdU-negative and are likely to be in meiotic prophase; nuclei whose DAPI staining appears round are BrdU-positive and are likely to be in premeiotic S-phase (white arrowheads). (B) 4-h BrdU pulse. (C) 8-h BrdU pulse. All mitotic germ cells contain some BrdU label. Inset, boxed region. Lightly labeled germ cell in box (white arrowhead) is shown in a different focal plane in inset (white arrowhead). (D) Percent BrdU-positive nuclei in the high mitotic index region at increasing times of BrdU treatment. Each circle represents one germ line; red filled circles represent germ lines in which all germ cells show some BrdU labeling. Red lines indicate mean. This data represents all except the proximal 4 rows of the mitotic region; more proximal rows frequently contained several unlabeled nuclei even after 12 h, but most (>95%) were labeled. (E) Percent BrdU-positive nuclei at different positions along the distal-proximal axis. Each line represents data from all nuclei in a 2-row interval along the distal-proximal axis. Time course for complete incorporation is similar at these positions.
Figure 5.
No label-retaining cells in germline mitotic region. (A) Summary of BrdU pulse-chase experiments. Left, developmental stage indicated, including either hours after hatching (top) or hours after L4 (bottom). Red bar, interval feeding BrdU-labeled bacteria; blue bar, interval feeding unlabeled bacteria; *, experiments in C–G are examples from these time points. (B) Percent BrdU-positive nuclei in mitotic region. (n), number germ lines scored. (C–G) Projected confocal _z_-series of representative germ lines after BrdU pulse and chase. Arrowhead, distal end; pink, BrdU; blue, TO-PRO-3 DNA staining; dashed line, MR/TZ boundary. (C) 0-h chase. All germ cells in mitotic region are BrdU labeled. (D) 12-h chase. BrdU staining has decreased in mitotic region. (E) 24-h chase. BrdU staining has further decreased in mitotic region. (F) 48-h chase. Little or no BrdU staining in mitotic region. No complete nuclei are stained; flecks of staining are likely to label bits of chromosomes. (G) Lower magnification image of entire germ line shown in part in F. BrdU has moved into mature oocytes. (H) Negative control. Germ line extruded from an adult that has not been exposed to BrdU, but is stained with anti-BrdU antibodies.
Figure 6.
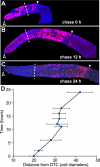
Germ cells move proximally from mitotic region into meiotic zone. Animals were pulsed for 30 min with BrdU and then chased for increasing times. (A–C) Projected _z_-series of extruded germlines stained with anti-BrdU (pink) and TO-PRO-3 (blue). Arrowhead, distal end; dashed line, MR/TZ boundary. The white arrowhead marks the proximal edge of BrdU staining. (A) 0-h chase. Most BrdU-labeled nuclei are in mitotic region with some in transition zone. (B) 12-h chase. BrdU-labeled nuclei have just moved into the pachytene region (∼12 rows past MR/TZ boundary). (C) 24-h chase. BrdU-labeled nuclei have moved further proximally into the pachytene region (∼27 rows past the MR/TZ boundary). (D) Position of proximal boundary of BrdU-positive nuclei (_x_-axis) graphed with respect to length of chase (_y_-axis).
Figure 7.
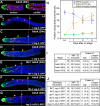
Configuration and extent of DTC processes. (A) Adult hermaphrodite germ line, 24 h past mid-L4. Each part of the panel is a projection of two confocal sections in adjacent focal planes from the same germ line. Green, GFP; red, anti-GLP-1; blue, TO-PRO-3. The DTC extends short processes that intercalate between and nearly surround germ cells in the first 2 rows along the distal-proximal axis. (B–F) Images are projections of confocal _z_-series. Genotype and reporter GFP indicated in figure. Green, GFP; pink, anti-PH3; blue, TO-PRO-3. Green triangle, proximal extent of extensive DTC contact; yellow circle, proximal extent of longest DTC process; diamond with dashed line, MR/TZ boundary. (B) +; qIs56 L4 germ line. (C) +; qIs56 adult germ line, 24 h after L4. (D) +; qIs56 adult germ line, 72 h after L4. (E–G) DTC process length does not change in mutants that affect the position of meiotic entry. (E) fbf-1(ok91); qIs56. (F) fbf-2(q738); qIs56. DTC maintains extensive contact with distal-most 4 rows of germ cells and extends processes up to 12 cell diameters in a wild-type background as well as in mutants that shorten (fbf-1) and lengthen (fbf-2) the mitotic region. (G) +; qEx319. Germline from animal carrying the lag-2::LAG-2::MYC construct. Green is anti-MYC, pink is anti-PH3, blue is TO-PRO-3. LAG-2::MYC fusion protein is found throughout the DTC and its processes. (H) Graph comparing position of MR/TZ boundary to extent of DTC cap and length of longest continuous process. DTC maintains extensive contact with distal-most 3 or 4 rows of germ cells (green square) and has no long processes in L4, extends processes ∼12 and 18 cell diameters proximal from the DTC body 24 and 72 h after L4, respectively. Although the DTC processes lengthen, the beginning of meiotic prophase occurs closer to the DTC body with age. Note that mitoses, as indicated by PH3 staining, can occur in germ cells that do not contact the DTC or its processes (L4 and 24 h). This is also apparent in older animals when individual _z_-slices are examined. Although the MR shortens, cell number does not decrease dramatically with age (see first section of Results). (I and J) Charts with data for wild-type at different stages (I) and mutants at 24 h after L4 (J).
Figure 8.
Orientation of cell divisions in mitotic region. (A) The orientation of mitotic spindles and/or metaphase plates was scored as along, across or oblique to the distal-proximal axis at each position. The majority of mitotic germ cells are found in the first 16 rows of the germ line; the likelihood of finding a germ cell in M-phase decreases more proximally. (B–E) Germ lines were stained with DAPI (white) or DAPI (white) and anti-tubulin (green). Arrowheads, distal ends. Germ cells in two different germ lines dividing across the distal-proximal axis at position 1, adjacent to the DTC (DAPI in B and anti-tubulin in C), oblique to the distal-proximal axis at position 1 (DAPI in D), or along the distal-proximal axis at position 5 (DAPI and anti-tubulin in E).
Figure 9.
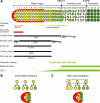
Summary and working model for the germline mitotic region. (A) Diagram of germ cells in the mitotic region. Red, distal tip cell. Undifferentiated germ cells, yellow; germ cells showing some marker of differentiation, green or gradient of yellow to green. MR/TZ, average boundary between mitotic region and transition zone; TZ/PR, average boundary between transition zone and pachytene region. Proposed sites of GSCs (orange dotted line) and the switch (graded yellow to green dotted line) from mitosis to meiosis, based on the estimated position of premeiotic S cells (green dotted line) and GLD-1 expression (green bar). GLD-1 expression was reported elsewhere (Jones et al., 1996; Hansen et al., 2004b). Black bars summarize cell cycle data with respect to position along the distal/proximal axis. The lower mitotic index in the distal-most germ cells also seen by Maciejowski et al. (2006). (B) Control by stem cell asymmetric divisions. Above, each stem cell generates one stem cell daughter (self-renewal) and one daughter destined to differentiate. Below, the two daughters occupy distinct positions relative to the niche (red). (C) Control by a stem cell population. Above, stem cells generate stem cell daughters as well as daughters destined to differentiate, either by symmetrical or asymmetrical divisions. Below, daughter cell position relative to the niche (red). Daughters within niche retain stem cell characteristics. We propose that this is how GSCs are controlled in the C. elegans adult hermaphrodite germline.
Similar articles
- Analysis of Germline Stem Cell Differentiation Following Loss of GLP-1 Notch Activity in Caenorhabditis elegans.
Fox PM, Schedl T. Fox PM, et al. Genetics. 2015 Sep;201(1):167-84. doi: 10.1534/genetics.115.178061. Epub 2015 Jul 8. Genetics. 2015. PMID: 26158953 Free PMC article. - The C. elegans adult male germline: stem cells and sexual dimorphism.
Morgan DE, Crittenden SL, Kimble J. Morgan DE, et al. Dev Biol. 2010 Oct 15;346(2):204-14. doi: 10.1016/j.ydbio.2010.07.022. Epub 2010 Jul 24. Dev Biol. 2010. PMID: 20659446 Free PMC article. - C. elegans RNA-binding proteins PUF-8 and MEX-3 function redundantly to promote germline stem cell mitosis.
Ariz M, Mainpal R, Subramaniam K. Ariz M, et al. Dev Biol. 2009 Feb 15;326(2):295-304. doi: 10.1016/j.ydbio.2008.11.024. Epub 2008 Dec 7. Dev Biol. 2009. PMID: 19100255 Free PMC article. - Scratching the niche that controls Caenorhabditis elegans germline stem cells.
Byrd DT, Kimble J. Byrd DT, et al. Semin Cell Dev Biol. 2009 Dec;20(9):1107-13. doi: 10.1016/j.semcdb.2009.09.005. Epub 2009 Sep 16. Semin Cell Dev Biol. 2009. PMID: 19765664 Free PMC article. Review. - Germline proliferation and its control.
Kimble J, Crittenden SL. Kimble J, et al. WormBook. 2005 Aug 15:1-14. doi: 10.1895/wormbook.1.13.1. WormBook. 2005. PMID: 18050413 Free PMC article. Review.
Cited by
- Chromosome-wide mechanisms to decouple gene expression from gene dose during sex-chromosome evolution.
Wheeler BS, Anderson E, Frøkjær-Jensen C, Bian Q, Jorgensen E, Meyer BJ. Wheeler BS, et al. Elife. 2016 Aug 30;5:e17365. doi: 10.7554/eLife.17365. Elife. 2016. PMID: 27572259 Free PMC article. - Deficiency of cardiolipin synthase causes abnormal mitochondrial function and morphology in germ cells of Caenorhabditis elegans.
Sakamoto T, Inoue T, Otomo Y, Yokomori N, Ohno M, Arai H, Nakagawa Y. Sakamoto T, et al. J Biol Chem. 2012 Feb 10;287(7):4590-601. doi: 10.1074/jbc.M111.314823. Epub 2011 Dec 15. J Biol Chem. 2012. PMID: 22174409 Free PMC article. - C. elegans GLP-1/Notch activates transcription in a probability gradient across the germline stem cell pool.
Lee C, Sorensen EB, Lynch TR, Kimble J. Lee C, et al. Elife. 2016 Oct 5;5:e18370. doi: 10.7554/eLife.18370. Elife. 2016. PMID: 27705743 Free PMC article. - SIN-3 acts in distinct complexes to regulate the germline transcriptional program in Caenorhabditis elegans.
Robert VJ, Caron M, Gely L, Adrait A, Pakulska V, Couté Y, Chevalier M, Riedel CG, Bedet C, Palladino F. Robert VJ, et al. Development. 2023 Nov 1;150(21):dev201755. doi: 10.1242/dev.201755. Epub 2023 Oct 17. Development. 2023. PMID: 37818613 Free PMC article. - Phasor approach to fluorescence lifetime microscopy distinguishes different metabolic states of germ cells in a live tissue.
Stringari C, Cinquin A, Cinquin O, Digman MA, Donovan PJ, Gratton E. Stringari C, et al. Proc Natl Acad Sci U S A. 2011 Aug 16;108(33):13582-7. doi: 10.1073/pnas.1108161108. Epub 2011 Aug 1. Proc Natl Acad Sci U S A. 2011. PMID: 21808026 Free PMC article.
References
- Aherne W. A., Camplejohn R. S., Wright N. A. An Introduction to Cell Population Kinetics. London: Edward Arnold; 1977.
- Austin J., Kimble J. glp-1 is required in the germ line for regulation of the decision between mitosis and meiosis in C. elegans. Cell. 1987;51:589–599. - PubMed
- Blelloch R., Santa Anna-Arriola S., Gao D., Li Y., Hodgkin J., Kimble J. The gon-1 gene is required for gonadal morphogenesis in Caenorhabditis elegans. Dev. Biol. 1999;216:382–393. - PubMed
- Braun K. M., Watt F. M. Epidermal label-retaining cells: background and recent applications. J. Investig. Dermatol. Symp. Proc. 2004;9:196–201. - PubMed
- Brawley C., Matunis E. Regeneration of male germline stem cells by spermatogonial dedifferentiation in vivo. Science. 2004;304:1331–1334. - PubMed
MeSH terms
Substances
LinkOut - more resources
Full Text Sources
Molecular Biology Databases
