The Fat1 cadherin integrates vascular smooth muscle cell growth and migration signals - PubMed (original) (raw)
The Fat1 cadherin integrates vascular smooth muscle cell growth and migration signals
Rong Hou et al. J Cell Biol. 2006.
Abstract
The significance of cadherin superfamily proteins in vascular smooth muscle cell (VSMC) biology is undefined. Here we describe recent studies of the Fat1 protocadherin. Fat1 expression in VSMCs increases significantly after arterial injury or growth factor stimulation. Fat1 knockdown decreases VSMC migration in vitro, but surprisingly, enhances cyclin D1 expression and proliferation. Despite limited similarity to classical cadherins, the Fat1 intracellular domain (Fat1(IC)) interacts with beta-catenin, inhibiting both its nuclear localization and transcriptional activity. Fat1 undergoes cleavage and Fat1(IC) species localize to the nucleus; however, inhibition of the cyclin D1 promoter by truncated Fat1(IC) proteins corresponds to their presence outside the nucleus, which argues against repression of beta-catenin-dependent transcription by nuclear Fat1(IC). These findings extend recent observations about Fat1 and migration in other cell types, and demonstrate for the first time its anti-proliferative activity and interaction with beta-catenin. Because it is induced after arterial injury, Fat1 may control VSMC functions central to vascular remodeling by facilitating migration and limiting proliferation.
Figures
Figure 1.
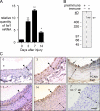
Expression of Fat1 in normal and balloon-injured rat carotid arteries. (A) qPCR analysis of fat1 mRNA expression. Fat1 mRNA levels were corrected relative to gapdh mRNA levels, with day 0 (no injury) set = 1. *, P < 0.05, **, P < 0.01 vs. day 0. Data show the means ± SEM. (B) specificity of anti-Fat1 antiserum. Preimmune and anti-Fat1 immune rabbit sera (1:5,000 dilutions) were tested by immunoblotting of replicate total RASMC protein extracts (20 μg/lane). Arrow indicates Fat1 signal. (C) Immunohistochemical analysis of Fat1 expression in arteries 0, 3, 7, and 14 d after injury, as indicated. Fat1 immunoreactivity appears brown, with blue hematoxylin counterstain except in top right panel. Arrowheads indicate the internal elastic lamina, and double-ended arrows, the extent of the media. The neointima is the space between arrowhead and arrow. The orientation of all samples is similar, with an asterisk in the day 0 panel indicating the vessel lumen. The top right panel shows a day 7 sample costained for Fat1 (brown) and PCNA (blue); areas of increased Fat1 (arrow) and increased PCNA (arrowhead) staining are indicated. The bottom right panel shows a day 7 sample in which Fat1 antiserum was omitted (no 1° ab). Scale bar, 100 μm.
Figure 2.
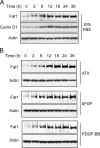
Western analysis of Fat1 expression in RASMCs. Cells were serum deprived, stimulated as described, and harvested for protein extraction at the indicated time points. Actin expression is shown as a loading reference. Data are representative of three independent experiments. (A) Induction by 10% FBS for 0–36 h before protein extraction. The blot was also probed for cyclin D1. (B) Induction by specific factors. Cells were stimulated with 10−6 mol/L ATII, 20 ng/ml bFGF, or 20 ng/ml PDGF-BB.
Figure 3.
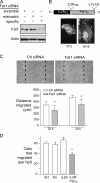
Effect of decreased Fat1 expression on VSMC migration. (A) Western analysis of Fat1 specific and control siRNA efficacy, 48 h after transfection. (B) Schematic diagram of IL2R-Fat1IC. EC, extracellular; TM, transmembrane; IC, intracellular, with photomicrograph of subcellular localization of IL2R-Fat1IC-3XFLAG in transfected cells stained with FITC-conjugated anti-FLAG antibody. Arrowheads indicate cell surface staining. (C) MASMC migration 30 h after wounding of monolayer. Dashed lines indicate extent of initial denudation. Bottom, quantitative analysis of MASMC migration after control (Ctl) and specific Fat1 siRNA transfection. For 10 matched fields, the area of the wounded monolayer covered by cells at the indicated time points was determined by planimetry using NIH Image, and distance migrated calculated according to the difference from time 0. *, P < 0.05 vs. Ctl siRNA. (D) Transwell migration assay of A7r5 cells transduced with the indicated retroviruses. Six fields were counted per condition, and the values were averaged for each filter. Data show the means ± SEM. *, P < 0.05 vs. other groups.
Figure 4.
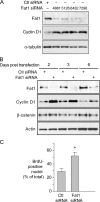
Effect of decreased Fat1 expression on VSMC cell cycle progression. (A and B) Western analyses of Fat1 and cyclin D1 expression with control (Ctl) or Fat1-specific siRNAs. (A) Four distinct Fat1-specific siRNAs were transfected 48 h before protein extraction. Loading reference, α-tubulin. (B) Efficacy of Ctl or Fat1-specific siRNA 7296 over time. Actin and β-catenin expression were also tested. (C) Effect of Fat1 inhibition on DNA synthesis assessed by BrdU incorporation. Cells were transfected with Ctl or Fat1 siRNA, serum deprived for 48 h, and stimulated with 10% FBS. BrdU incorporation was assessed as described in Materials and methods. The graph depicts the means ± SEM of three independent experiments in which a total of 219–874 cells were counted each time for each group. *, P < 0.05 vs. Ctl siRNA.
Figure 5.
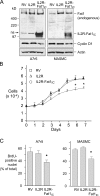
Effect of IL2R-Fat1IC expression on VSMC growth. RV, IL2R, and IL2R-Fat1IC designate A7r5 or MASMCs transduced with the corresponding retroviral constructs. (A) Western analyses of IL2R-Fat1IC expression in A7r5 and MASMC stable transfectants. A nonspecific band (ns) near the IL2R-Fat1IC protein is indicated. The blots were also probed for cyclin D1 and actin. (B) Effect of IL2R-Fat1IC on A7r5 cell growth. Cell number was calculated by CyQuant fluorescence assay by reference to a standard curve. (C) Effect of IL2R-Fat1IC on DNA synthesis in A7r5 and MASMCs, evaluated by BrdU incorporation. Data show the means ± SEM. *, P < 0.05 vs. control.
Figure 6.
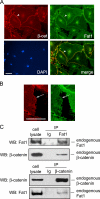
Co-localization and interaction of endogenous β-catenin and Fat1 in VSMCs. (A) Immunofluorescence analysis of β-catenin (β-cat, red), Fat1 (green), and areas of colocalization (merge, yellow). Nuclei were stained with DAPI (blue), as indicated. β-Catenin and Fat1 colocalization at cell–cell junctions is indicated by an arrowhead. Bar (10 μm) applies to all panels. (B) Detail from panels in A, showing staining for Fat1 (green), but not β-catenin (red), at the cellular free edge. Bar, 10 μm. (C) Co-immunoprecipitation of endogenous β-catenin and Fat1. Cell lysates were incubated with antibodies specific for Fat1 (top) or β-catenin (bottom) or normal rabbit or mouse IgG, and the immunoprecipitated complexes were analyzed by Western blot for Fat1 and β-catenin, as indicated.
Figure 7.
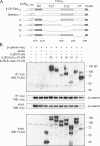
Identification of β-catenin-interacting residues in the Fat1IC domain by coimmunoprecipitation of epitope-tagged proteins. (A) Schematic depiction of FLAG-tagged IL2R-Fat1IC deletion constructs. Fat1IC domains indicated: juxtamembrane (JM), FC1, FC2, carboxy-terminus (CT). (B) Western analysis of immunoprecipitated protein complexes. The indicated constructs were transfected into 293T cells. Top: after 24 h, total cellular protein (400 μg) was harvested and analyzed by immunoprecipitation and Western blotting (WB) with antibodies against the epitope tags, as indicated. Bottom: protein input (7.5%). An analogous E-cadherin–derived construct (IL2R-E-cadIC-FLAG) was used as a positive control.
Figure 8.
Effect of Fat1IC overexpression on β-catenin nuclear localization in VSMCs. (A) Immunofluorescence analysis of β-catenin subcellular localization in IL2R-GFP-RV (top) and IL2R-Fat1IC-GFP-RV (bottom) transduced RASMCs. Cells were treated with LiCl (20 mmol/L) for 6 h, and then stained with anti-β-catenin antibody and DAPI. Transduced cells were identified by coexpressed GFP. Arrows indicate nuclear β-catenin signal of untransduced and transduced cells within each panel (see text). Bar, 10 μm. (B) Western analysis of β-catenin in membrane (M), cytoplasmic (C), and nuclear (N) fractions extracted from IL2R-GFP-RV and IL2R-Fat1IC-GFP-RV transduced A7r5 cells treated with LiCl, as above. The blot was probed for lamin A/C to assess fractionation and loading.
Figure 9.
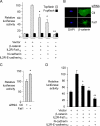
Effect of altered Fat1 expression on β-catenin transcriptional activity in VSMCs. (A) Topflash (TCF-luciferase reporter) activation. Topflash or Fopflash control was transfected into A7r5 cells along with expression constructs for β-catenin, IL2R-Fat1IC, N-cadherin, and/or IL2R-E-cadherinIC. The maximal reporter activity was set to 100. *, P < 0.05, **, P < 0.01, vs. activity with β-catenin alone. (B) β-Catenin localization in MASMCs transfected with control (Ctl, scrambled) or Fat1-specific (7296) siRNAs and stimulated with LiCl (20 mM) for 12 h. (C) Topflash activity with decreased Fat1 expression. MASMCs transfected with the indicated siRNAs and the Topflash reporter were stimulated with LiCl (20 mM) for 12 h before assay for luciferase activity. *, P < 0.05, vs. activity with Ctl siRNA. (D) Cyclin D1 promoter activation. The cyclin D1 promoter-luciferase construct was transfected into A7r5 cells along with test constructs, as in A. Data show the means ± SEM. *, P < 0.05, **, P < 0.01, vs. activity with β-catenin alone.
Figure 10.
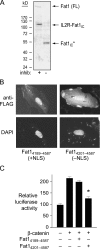
Cleavage, localization, and activity of Fat1 cytoplasmic sequences in VSMC protein extracts. (A) Western analysis of A7r5 extracts transduced with IL2R-Fat1IC retrovirus. Total cellular protein was incubated at 37°C for 15 min with or without proteinase inhibitors (inhib). Both full-length (FL) Fat1 and the fusion protein (IL2R-Fat1IC) are apparent with proteinase inhibition; only a single band (Fat1IC*) of ∼50 kD is seen without inhibition. (B) Subcellular localization of the FLAG-tagged Fat1 cytoplasmic domain with (Fat14189–4587) or without (Fat14201–4587) the putative NLS in transfected A7r5 cells. Anti-FLAG immunofluorescence and DAPI nuclear stains are shown. (C) Effect of the NLS on Fat1IC-mediated inhibition of β-catenin activation of the cyclin D1 promoter. Luciferase activity was assessed 24 h after transfection of A7r5 cells with the indicated expression constructs and the cyclin D1 promoter reporter. Data show the means ± SEM. *, P < 0.01 vs. activity with β-catenin alone.
Similar articles
- R-cadherin:beta-catenin complex and its association with vascular smooth muscle cell proliferation.
Slater SC, Koutsouki E, Jackson CL, Bush RC, Angelini GD, Newby AC, George SJ. Slater SC, et al. Arterioscler Thromb Vasc Biol. 2004 Jul;24(7):1204-10. doi: 10.1161/01.ATV.0000130464.24599.e0. Epub 2004 Apr 29. Arterioscler Thromb Vasc Biol. 2004. PMID: 15117735 - Atrophin proteins interact with the Fat1 cadherin and regulate migration and orientation in vascular smooth muscle cells.
Hou R, Sibinga NE. Hou R, et al. J Biol Chem. 2009 Mar 13;284(11):6955-65. doi: 10.1074/jbc.M809333200. Epub 2009 Jan 7. J Biol Chem. 2009. PMID: 19131340 Free PMC article. - The FAT1 Cadherin Drives Vascular Smooth Muscle Cell Migration.
Riascos-Bernal DF, Ressa G, Korrapati A, Sibinga NES. Riascos-Bernal DF, et al. Cells. 2023 Jun 14;12(12):1621. doi: 10.3390/cells12121621. Cells. 2023. PMID: 37371091 Free PMC article. Review. - MMP-9 and -12 cause N-cadherin shedding and thereby beta-catenin signalling and vascular smooth muscle cell proliferation.
Dwivedi A, Slater SC, George SJ. Dwivedi A, et al. Cardiovasc Res. 2009 Jan 1;81(1):178-86. doi: 10.1093/cvr/cvn278. Epub 2008 Oct 13. Cardiovasc Res. 2009. PMID: 18852254 - Regulation of VSMC behavior by the cadherin-catenin complex.
Lyon C, Mill C, Tsaousi A, Williams H, George S. Lyon C, et al. Front Biosci (Landmark Ed). 2011 Jan 1;16(2):644-57. doi: 10.2741/3711. Front Biosci (Landmark Ed). 2011. PMID: 21196194 Review.
Cited by
- Increased neointimal thickening in dystrophin-deficient mdx mice.
Rauch U, Shami A, Zhang F, Carmignac V, Durbeej M, Hultgårdh-Nilsson A. Rauch U, et al. PLoS One. 2012;7(1):e29904. doi: 10.1371/journal.pone.0029904. Epub 2012 Jan 4. PLoS One. 2012. PMID: 22238670 Free PMC article. - Machine Learning-based Classification of transcriptome Signatures of non-ulcerative Bladder Pain Syndrome.
Akshay A, Besic M, Kuhn A, Burkhard FC, Bigger-Allen A, Adam RM, Monastyrskaya K, Gheinani AH. Akshay A, et al. bioRxiv [Preprint]. 2024 Jan 8:2024.01.08.574189. doi: 10.1101/2024.01.08.574189. bioRxiv. 2024. PMID: 38260635 Free PMC article. Updated. Preprint. - Beta-catenin signalling in mesenchymal islet-derived precursor cells.
Ikonomou L, Geras-Raaka E, Raaka BM, Gershengorn MC. Ikonomou L, et al. Cell Prolif. 2008 Jun;41(3):474-91. doi: 10.1111/j.1365-2184.2008.00527.x. Epub 2008 Apr 14. Cell Prolif. 2008. PMID: 18422699 Free PMC article. - FAT4 overexpression promotes antitumor immunity by regulating the β-catenin/STT3/PD-L1 axis in cervical cancer.
Wang D, Wu S, He J, Sun L, Zhu H, Zhang Y, Liu S, Duan X, Wang Y, Xu T. Wang D, et al. J Exp Clin Cancer Res. 2023 Sep 1;42(1):222. doi: 10.1186/s13046-023-02758-2. J Exp Clin Cancer Res. 2023. PMID: 37658376 Free PMC article. - CDH13 promoter methylation regulates cisplatin resistance of non-small cell lung cancer cells.
Wang Y, Zhang L, Yang J, Li B, Wang J. Wang Y, et al. Oncol Lett. 2018 Nov;16(5):5715-5722. doi: 10.3892/ol.2018.9325. Epub 2018 Aug 20. Oncol Lett. 2018. PMID: 30344726 Free PMC article.
References
- Angst, B.D., C. Marcozzi, and A.I. Magee. 2001. The cadherin superfamily: diversity in form and function. J. Cell Sci. 114:629–641. - PubMed
- Bhanot, P., M. Fish, J.A. Jemison, R. Nusse, J. Nathans, and K.M. Cadigan. 1999. Frizzled and Dfrizzled-2 function as redundant receptors for Wingless during Drosophila embryonic development. Development. 126:4175–4186. - PubMed
- Bustin, S.A. 2000. Absolute quantification of mRNA using real-time reverse transcription polymerase chain reaction assays. J. Mol. Endocrinol. 25:169–193. - PubMed
- Castillejo-Lopez, C., W.M. Arias, and S. Baumgartner. 2004. The fat-like gene of Drosophila is the true orthologue of vertebrate fat cadherins and is involved in the formation of tubular organs. J. Biol. Chem. 279:24034–24043. - PubMed
Publication types
MeSH terms
Substances
LinkOut - more resources
Full Text Sources
Other Literature Sources
Molecular Biology Databases
Research Materials
Miscellaneous
