Loss of Siglec expression on T lymphocytes during human evolution - PubMed (original) (raw)
Loss of Siglec expression on T lymphocytes during human evolution
Dzung H Nguyen et al. Proc Natl Acad Sci U S A. 2006.
Abstract
We report here that human T cells give much stronger proliferative responses to specific activation via the T cell receptor (TCR) than those from chimpanzees, our closest evolutionary relatives. Nonspecific activation using phytohemagglutinin was robust in chimpanzee T cells, indicating that the much lower response to TCR simulation is not due to any intrinsic inability to respond to an activating stimulus. CD33-related Siglecs are inhibitory signaling molecules expressed on most immune cells and are thought to down-regulate cellular activation pathways via cytosolic immunoreceptor tyrosine-based inhibitory motifs. Among human immune cells, T lymphocytes are a striking exception, expressing little to none of these molecules. In stark contrast, we find that T lymphocytes from chimpanzees as well as the other closely related "great apes" (bonobos, gorillas, and orangutans) express several CD33-related Siglecs on their surfaces. Thus, human-specific loss of T cell Siglec expression occurred after our last common ancestor with great apes, potentially resulting in an evolutionary difference with regard to inhibitory signaling. We confirmed this by studying Siglec-5, which is prominently expressed on chimpanzee lymphocytes, including CD4 T cells. Ab-mediated clearance of Siglec-5 from chimpanzee T cells enhanced TCR-mediated activation. Conversely, primary human T cells and Jurkat cells transfected with Siglec-5 become less responsive; i.e., they behave more like chimpanzee T cells. This human-specific loss of T cell Siglec expression associated with T cell hyperactivity may help explain the strikingly disparate prevalence and severity of T cell-mediated diseases such as AIDS and chronic active hepatitis between humans and chimpanzees.
Conflict of interest statement
Conflict of interest statement: No conflicts declared.
Figures
Fig. 1.
Differences in human and chimpanzee T cell activation by PHA and anti-CD3/anti-CD28. Human and chimpanzee T lymphocytes were stimulated with 10 μg/ml soluble PHA (A) or with immobilized anti-CD3 (2.5 μg/ml coating concentration) plus 0.1 μg/ml soluble anti-CD28 (B). Cells were collected and counted on a FACSCalibur on the indicated days at 60 μl/min for 30 s. A log scale is used on the y axis to accommodate the range of values seen. Human and chimpanzee lymphocytes were labeled with anti-CD3 or anti-CD28 and detected with PE goat anti-mouse IgG (C). The control histogram indicates the human lymphocyte population in the presence of secondary Ab only. One representative pair of three human and chimpanzee comparisons is presented in A. The same donor pair is presented in B as solid symbols, along with another pair of human and chimpanzee samples (filled symbols).
Fig. 2.
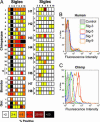
Expression of CD33rSiglecs on human and great ape lymphocytes. (A) Percentage of positive lymphocytes for each Siglec Ab (staining above negative controls) for 16 chimpanzees, 5 bonobos, and 3 gorillas are shown, as well as data for 8 humans (the latter were tested on one or more occasions). Examples of flow cytometry histograms of human (B) and chimpanzee (C) lymphocytes using Abs recognizing Siglec-3, Siglec-5, Siglec-7, and Siglec-9 (y axis: normalized cell numbers expressed as percent of maximum cell number detected). In later samples examined, low levels of Siglec-11 staining (<5% positive) were occasionally detected on lymphocytes in both great apes and humans (data not shown).
Fig. 3.
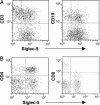
Anti-Siglec-5 Abs stain chimpanzee T and B cells. Chimpanzee lymphocytes were double-labeled with anti-Siglec-5 and PE-goat anti-mouse IgG and with APC-anti-CD3 or APC-anti-CD19 (A) or with FITC-anti-CD4 and PE-Cy5-anti-CD8 (B). Results for CD3 and CD19 are representative of seven individuals, and results for CD4 and CD8 are representative of two individuals.
Fig. 4.
Enhanced chimpanzee T cell response to anti-CD3 after anti-Siglec-5 Ab treatment. Human and chimpanzee T lymphocytes were stimulated with immobilized anti-CD3 plus soluble anti-CD28. For the indicated samples, anti-Siglec-5 was added at 5 μg/ml to chimpanzee lymphocytes in solution. Cells were analyzed by flow cytometry after 3 days of stimulation. Increases in forward scatter and side scatter indicate increases in cell size and internal complexity/granularity, respectively. Dead cells were excluded from analysis. Results are representative of four different samples from one chimpanzee.
Fig. 5.
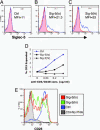
Human T cell Siglec-5 expression inhibits responses to soluble anti-CD3/anti-CD28 and PHA. Unstimulated monocyte-depleted PBMCs were mock-transfected with no DNA (A) or transfected with 2 or 3 μg of pSig5 (B and C) by using the Nucleofector apparatus. After 24 h, cells were labeled with nonspecific mouse IgG (red filled histograms) or anti-Siglec-5 (blue open histograms). MFI, mean fluorescence intensity of Siglec-5 expression. The resulting cell populations were named control (Ctrl), Sig-5(lo), and Sig-5(hi) based on Siglec-5 expression levels. (D) Transfected cells were stimulated with soluble anti-CD3 plus soluble anti-CD28 at the indicated concentrations for 3 days. The percentages of size-expanded cells are plotted with no stimulation background controls subtracted. Similar results were observed with a different PBMC donor. (E) Transfected cells were stimulated with 10 μg/ml PHA for 3 days and then analyzed for CD25 expression. The histograms for CD25 staining are shown.
Fig. 6.
Expression of Siglec-5 in human T cell inhibits responses to anti-CD3/anti-CD28 beads. (A) Unstimulated monocyte-depleted PBMCs were mock-transfected with no DNA or transfected with 1, 2, or 3 μg of pSig5 by using the Nucleofector device. After 24 h, cells were labeled with anti-Siglec-5 and goat anti-mouse IgG Alexa Fluor 488. MFI, mean fluorescence intensity of Siglec-5 expression. Transfected cells were stimulated with anti-CD3/anti-CD28-bearing beads (B_–_D). After 3 days of stimulation, cells were analyzed for expansion in size and intracellular complexity/granularity (B) and increase in CD25 expression (C and D). Beads and bead-bound cells were excluded from analysis by forward scatter gating and positive autofluorescence of FL3.
Fig. 7.
Siglec-5 expression on Jurkat T cells inhibits anti-CD3-induced intracellular calcium mobilization. Jurkat cells were mock-transfected with no DNA or transfected with 2 μg of pSig5 per 2 × 10⁶ cells using the Nucleofector device. After 24 h, Siglec-5 expression was analyzed by flow cytometry with anti-Siglec-5 and goat anti-mouse IgG Alexa Fluor 488, by using a nonspecific mouse IgG as background (A). The percentage of Siglec-5-positive cells is indicated. Transfected cells were loaded with calcium-sensing dyes, Fluo-4 and Fura Red, and then analyzed for responses to soluble anti-CD3 by real-time flow cytometric analysis (B). The arrow at 60 s indicates the time of mAb addition. The experiment was repeated twice with different transfectant Jurkat cells and produced similar results.
Similar articles
- Relative over-reactivity of human versus chimpanzee lymphocytes: implications for the human diseases associated with immune activation.
Soto PC, Stein LL, Hurtado-Ziola N, Hedrick SM, Varki A. Soto PC, et al. J Immunol. 2010 Apr 15;184(8):4185-95. doi: 10.4049/jimmunol.0903420. Epub 2010 Mar 15. J Immunol. 2010. PMID: 20231688 Free PMC article. - Evolution of CD33-related siglecs: regulating host immune functions and escaping pathogen exploitation?
Cao H, Crocker PR. Cao H, et al. Immunology. 2011 Jan;132(1):18-26. doi: 10.1111/j.1365-2567.2010.03368.x. Epub 2010 Nov 11. Immunology. 2011. PMID: 21070233 Free PMC article. Review. - Loss of N-glycolylneuraminic acid in human evolution. Implications for sialic acid recognition by siglecs.
Brinkman-Van der Linden EC, Sjoberg ER, Juneja LR, Crocker PR, Varki N, Varki A. Brinkman-Van der Linden EC, et al. J Biol Chem. 2000 Mar 24;275(12):8633-40. doi: 10.1074/jbc.275.12.8633. J Biol Chem. 2000. PMID: 10722703 - Siglecs as positive and negative regulators of the immune system.
Crocker PR, Redelinghuys P. Crocker PR, et al. Biochem Soc Trans. 2008 Dec;36(Pt 6):1467-71. doi: 10.1042/BST0361467. Biochem Soc Trans. 2008. PMID: 19021577 Review.
Cited by
- Safety and immunotoxicity assessment of immunomodulatory monoclonal antibodies.
Brennan FR, Morton LD, Spindeldreher S, Kiessling A, Allenspach R, Hey A, Muller PY, Frings W, Sims J. Brennan FR, et al. MAbs. 2010 May-Jun;2(3):233-55. doi: 10.4161/mabs.2.3.11782. Epub 2010 May 23. MAbs. 2010. PMID: 20421713 Free PMC article. Review. - Pre-Clinical Assessment of Immune Responses to Adeno-Associated Virus (AAV) Vectors.
Basner-Tschakarjan E, Bijjiga E, Martino AT. Basner-Tschakarjan E, et al. Front Immunol. 2014 Feb 7;5:28. doi: 10.3389/fimmu.2014.00028. eCollection 2014. Front Immunol. 2014. PMID: 24570676 Free PMC article. Review. - Defining the in vivo function of Siglec-F, a CD33-related Siglec expressed on mouse eosinophils.
Zhang M, Angata T, Cho JY, Miller M, Broide DH, Varki A. Zhang M, et al. Blood. 2007 May 15;109(10):4280-7. doi: 10.1182/blood-2006-08-039255. Epub 2007 Feb 1. Blood. 2007. PMID: 17272508 Free PMC article. - Evolution in health and medicine Sackler colloquium: Evolution of the human lifespan and diseases of aging: roles of infection, inflammation, and nutrition.
Finch CE. Finch CE. Proc Natl Acad Sci U S A. 2010 Jan 26;107 Suppl 1(Suppl 1):1718-24. doi: 10.1073/pnas.0909606106. Epub 2009 Dec 4. Proc Natl Acad Sci U S A. 2010. PMID: 19966301 Free PMC article. Review. - Treatment of allergic asthma: modulation of Th2 cells and their responses.
Bosnjak B, Stelzmueller B, Erb KJ, Epstein MM. Bosnjak B, et al. Respir Res. 2011 Aug 25;12(1):114. doi: 10.1186/1465-9921-12-114. Respir Res. 2011. PMID: 21867534 Free PMC article. Review.
References
- Crocker P. R., Varki A. Trends Immunol. 2001;22:337–342. - PubMed
- Crocker P. R. Curr. Opin. Pharmacol. 2005;5:431–437. - PubMed
- Varki A., Angata T. Glycobiology. 2006;16:1R–27R. - PubMed
- Ravetch J. V., Lanier L. L. Science. 2000;290:84–89. - PubMed
Publication types
MeSH terms
Substances
LinkOut - more resources
Full Text Sources
Other Literature Sources
Research Materials


