Distinct subtypes of somatostatin-containing neocortical interneurons revealed in transgenic mice - PubMed (original) (raw)
Distinct subtypes of somatostatin-containing neocortical interneurons revealed in transgenic mice
Yunyong Ma et al. J Neurosci. 2006.
Abstract
GABA-releasing inhibitory interneurons in the cerebral cortex can be classified by their neurochemical content, firing patterns, or axonal targets, to name the most common criteria, but whether classifications using different criteria converge on the same neuronal subtypes, and how many such subtypes exist, is a matter of much current interest and considerable debate. To address these issues, we generated transgenic mice expressing green fluorescent protein (GFP) under control of the GAD67 promoter. In two of these lines, named X94 and X98, GFP expression in the barrel cortex was restricted to subsets of somatostatin-containing (SOM+) GABAergic interneurons, similar to the previously reported "GIN" line (Oliva et al., 2000), but the laminar distributions of GFP-expressing (GFP+) cell bodies in the X94, X98, and GIN lines were distinct and nearly complementary. We compared neurochemical content and axonal distribution patterns of GFP+ neurons among the three lines and analyzed in detail electrophysiological properties in a dataset of 150 neurons recorded in whole-cell, current-clamp mode. By all criteria, there was nearly perfect segregation of X94 and X98 GFP+ neurons, whereas GIN GFP+ neurons exhibited intermediate properties. In the X98 line, GFP expression was found in infragranular, calbindin-containing, layer 1-targeting ("Martinotti") cells that had a propensity to fire low-threshold calcium spikes, whereas X94 GFP+ cells were stuttering interneurons with quasi fast-spiking properties, residing in and targeting the thalamo-recipient neocortical layers. We conclude that much of the variability previously attributed to neocortical SOM+ interneurons can be accounted for by their natural grouping into distinct subtypes.
Figures
Figure 1.
Laminar distribution patterns of GFP+ interneurons. GFP expression was visualized by anti-GFP immunocytochemistry in 40-μm-thick coronal sections from brains of 2- to 3-month-old animals. A–C, Low-power images. D–F, High-power images from different sections of the same brains. Histograms at the left margin of A–C show the laminar distribution of GFP+ neurons, counted in 50 μm bins in vertical strips through the barrel cortex. Bin heights in the three panels are to the same scale; the highest bin in A represents 30 counts. Note the nearly complementary distribution patterns of the three lines. The laminar boundaries indicated in C apply also to A and B; the dotted lines indicate the white matter border. D–F are not aligned by layers. Scale bar: A–C, 250 μm; D–F, 100 μm.
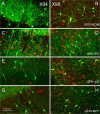
Figure 2.
Neurochemical identity of GFP+ interneurons. Confocal images of parasagittal sections from X94 (A, C, E, G) and X98 (B, D, F, H) barrel cortex are shown. GFP fluorescence is pseudocolored green; anti-SOM (A, B), anti-PV (C, D), anti-CB (E, F), and anti-NPY (G, H) immunoreactivity is pseudocolored red. Note that in both lines, all GFP+ neurons were SOM+ and PV−, but only X98 cells were CB+ (all) and NPY+ (some). The yellow seen in C represents overlap in the _z_-dimension between red-labeled SOM+ cell bodies and green-labeled GFP+ processes, not colocalization of the two labels.
Figure 3.
Comparison of axonal projections to layer 1. A–C, Digitally inverted confocal image stacks showing GFP-containing cell bodies and processes in the upper cortical layers of each line. Note the dense band of fluorescent fibers in layer 1 of X98 and GIN, but not X94, cortex.
Figure 4.
Morphological reconstructions of representative GFP+ neurons. A–L, Neurons were reconstructed in three dimensions using Neurolucida; cell bodies and dendrites are shown in green, axons in red. For ease of comparison, individual drawings were normalized to the same width of layer 4; average width of layer 4 was 240 ± 7.5 μm (mean ± SEM). The arrowheads in B–D point to a turning point of the axon, from the upper layers back to layer 4.
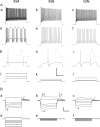
Figure 5.
Suprathreshold and subthreshold responses of GFP+ neurons. A, Spike trains in response to current steps of increasing amplitudes. Aa–Ac, Ad–Af, and Ag–Ai are responses to high, medium, and low current levels, respectively; the three current steps for each neuron are shown superimposed in Aj–Al. The asterisks in Ad denote interruptions in firing characteristic of stuttering X94 neurons; some GIN neurons also stuttered, but X98 neurons never did. The insets in Ag–Ai are the first action potential from the corresponding trace, shown at half the vertical scale and at a 100-fold expanded horizontal scale; note the pronounced difference in spike widths between lines. The arrowheads in Ah and Ai point to the characteristic triphasic AHP in X98 and GIN neurons. Calibration: 40 mV (Aa–Ai), 1000 pA (Aj–Al), 200 ms. B, Superimposed voltage responses (Ba–Bc) to the hyperpolarizing and small depolarizing current steps shown in Bd–Bf, in three other neurons. Note the very low input resistance of the X94 neuron compared with that of the X98 and GIN neurons (much larger current steps required to elicit similar voltage changes). The asterisks in Ba–Bc indicate the sag attributable to the hyperpolarization-activated cationic current _I_h. The open arrowheads in Ba and Bc denote a depolarizing rebound, also attributable to _I_h. The filled arrowheads in Bb point to bursts of action potentials riding on low-threshold Ca2+ spikes. Calibration: 20 mV (Ba–Bc), 300 pA (Bd–Bf), 200 ms.
Figure 6.
The ionic basis of the rebound burst. In all panels, control traces are drawn as thinner lines. CsCl (3 m
m
), which blocks the hyperpolarization-activated cationic current _I_h, blocked both the sag and the rebound depolarization in X94 and GIN cells (A, B, open arrowheads). In bursting X98 cells, CsCl blocked the sag (C, open arrowhead) but not the burst (filled arrowhead). In contrast, the _I_T channel blocker mibefradil (10 μm) did not block the sag (D, open arrowhead), but blocked the burst despite the large depolarizing rebound (filled arrowhead) evoked by a stronger hyperpolarization (−120 pA in mibefradil, compared with −40 pA in control). Note that in A–C, the superimposed responses in each panel were evoked by the same current step. Calibration: 40 mV, 200 ms.
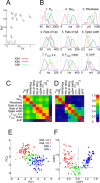
Figure 7.
Multivariate analysis of electrophysiological parameters. A, Grouping of parameters according to their CV and their η2. The nine numbered data points correspond, respectively, to the numbered parameters in B. The half-box (near the origin of axes) encloses parameters with η2 < 0.1 and CV < 0.35. **_B_**, Density plots (computed with a Gaussian kernel) of the nine parameters with _η2_ > 0.1, separated by transgenic line. Only the two extreme _x_-values are indicated for each plot. Parameters 1–3 are plotted in a logarithmic scale. C, Total-sample correlation matrix of parameters 1–9; the absolute values of the pairwise Pearson correlation coefficients are coded by color. D, Pooled within-group correlation matrix of the nine parameters. Note the separate clusters of passive (1–3) and active (4–9) parameters; parameters are correlated within, but not between, each cluster. E, Scatterplot of the electrophysiological parameters of the three neuronal subtypes in the principal component plane. Each principal component is a linear combination of the original 9 parameters; PC1 correlates strongly with active parameters, PC2 with passive parameters. X94 data points are separated into layer 4 and layer 5B cells. F, Scatterplot of the electrophysiological parameters of the three neuronal subsets in the canonical discriminant function plane. Each CDF is a linear combination of 11 electrophysiological parameters. X94 neurons are separated into layer 4 cells and layer 5B cells. The two intersecting lines separate the plane into three regions, with good segregation of the three groups into separate regions.
Comment in
- Somatostatin diversity in the inhibitory population.
Sabo SL, Sceniak MP. Sabo SL, et al. J Neurosci. 2006 Jul 19;26(29):7545-6. doi: 10.1523/jneurosci.2361-06.2006. J Neurosci. 2006. PMID: 16858831 Free PMC article. No abstract available.
Similar articles
- Characterizing the morphology of somatostatin-expressing interneurons and their synaptic innervation pattern in the barrel cortex of the GFP-expressing inhibitory neurons mouse.
Zhou X, Mansori I, Fischer T, Witte M, Staiger JF. Zhou X, et al. J Comp Neurol. 2020 Feb 1;528(2):244-260. doi: 10.1002/cne.24756. Epub 2019 Aug 24. J Comp Neurol. 2020. PMID: 31407339 - Novel hippocampal interneuronal subtypes identified using transgenic mice that express green fluorescent protein in GABAergic interneurons.
Oliva AA Jr, Jiang M, Lam T, Smith KL, Swann JW. Oliva AA Jr, et al. J Neurosci. 2000 May 1;20(9):3354-68. doi: 10.1523/JNEUROSCI.20-09-03354.2000. J Neurosci. 2000. PMID: 10777798 Free PMC article. - Selective, state-dependent activation of somatostatin-expressing inhibitory interneurons in mouse neocortex.
Fanselow EE, Richardson KA, Connors BW. Fanselow EE, et al. J Neurophysiol. 2008 Nov;100(5):2640-52. doi: 10.1152/jn.90691.2008. Epub 2008 Sep 17. J Neurophysiol. 2008. PMID: 18799598 Free PMC article. - Somatostatin-Expressing Inhibitory Interneurons in Cortical Circuits.
Yavorska I, Wehr M. Yavorska I, et al. Front Neural Circuits. 2016 Sep 29;10:76. doi: 10.3389/fncir.2016.00076. eCollection 2016. Front Neural Circuits. 2016. PMID: 27746722 Free PMC article. Review. - Neocortical inhibitory system.
Druga R. Druga R. Folia Biol (Praha). 2009;55(6):201-17. Folia Biol (Praha). 2009. PMID: 20163769 Review.
Cited by
- Beyond the frontiers of neuronal types.
Battaglia D, Karagiannis A, Gallopin T, Gutch HW, Cauli B. Battaglia D, et al. Front Neural Circuits. 2013 Feb 7;7:13. doi: 10.3389/fncir.2013.00013. eCollection 2013. Front Neural Circuits. 2013. PMID: 23403725 Free PMC article. - Subgroups of parvalbumin-expressing interneurons in layers 2/3 of the visual cortex.
Helm J, Akgul G, Wollmuth LP. Helm J, et al. J Neurophysiol. 2013 Mar;109(6):1600-13. doi: 10.1152/jn.00782.2012. Epub 2012 Dec 28. J Neurophysiol. 2013. PMID: 23274311 Free PMC article. - Laminar-Specific Alterations in Calbindin-Positive Boutons in the Prefrontal Cortex of Subjects With Schizophrenia.
Fish KN, Rocco BR, Wilson JD, Lewis DA. Fish KN, et al. Biol Psychiatry. 2023 Jul 15;94(2):142-152. doi: 10.1016/j.biopsych.2022.12.004. Epub 2022 Dec 8. Biol Psychiatry. 2023. PMID: 36868891 Free PMC article. - Tsc1 represses parvalbumin expression and fast-spiking properties in somatostatin lineage cortical interneurons.
Malik R, Pai EL, Rubin AN, Stafford AM, Angara K, Minasi P, Rubenstein JL, Sohal VS, Vogt D. Malik R, et al. Nat Commun. 2019 Nov 1;10(1):4994. doi: 10.1038/s41467-019-12962-4. Nat Commun. 2019. PMID: 31676823 Free PMC article. - Not all that glitters is gold: off-target recombination in the somatostatin-IRES-Cre mouse line labels a subset of fast-spiking interneurons.
Hu H, Cavendish JZ, Agmon A. Hu H, et al. Front Neural Circuits. 2013 Dec 10;7:195. doi: 10.3389/fncir.2013.00195. eCollection 2013. Front Neural Circuits. 2013. PMID: 24339803 Free PMC article. No abstract available.
References
- Beierlein M, Gibson JR, Connors BW (2003). Two dynamically distinct inhibitory networks in layer 4 of the neocortex. J Neurophysiol 90:2987–3000. - PubMed
- Butt SJ, Fuccillo M, Nery S, Noctor S, Kriegstein A, Corbin JG, Fishell G (2005). The temporal and spatial origins of cortical interneurons predict their physiological subtype. Neuron 48:591–604. - PubMed
Publication types
MeSH terms
Substances
LinkOut - more resources
Full Text Sources
Other Literature Sources
Molecular Biology Databases


