Ionic mechanisms of autorhythmic firing in rat cerebellar Golgi cells - PubMed (original) (raw)
Ionic mechanisms of autorhythmic firing in rat cerebellar Golgi cells
Lia Forti et al. J Physiol. 2006.
Abstract
Although Golgi cells (GoCs), the main type of inhibitory interneuron in the cerebellar granular layer (GL), are thought to play a central role in cerebellar network function, their excitable properties have remained unexplored. GoCs fire rhythmically in vivo and in slices, but it was unclear whether this activity originated from pacemaker ionic mechanisms. We explored this issue in acute cerebellar slices from 3-week-old rats by combining loose cell-attached (LCA) and whole-cell (WC) recordings. GoCs displayed spontaneous firing at 1-10 Hz (room temperature) and 2-20 Hz (35-37 degrees C), which persisted in the presence of blockers of fast synaptic receptors and mGluR and GABAB receptors, thus behaving, in our conditions, as pacemaker neurons. ZD 7288 (20 microM), a potent hyperpolarization-activated current (Ih) blocker, slowed down pacemaker frequency. The role of subthreshold Na+ currents (INa,sub) could not be tested directly, but we observed a robust TTX-sensitive, non-inactivating Na+ current in the subthreshold voltage range. When studying repolarizing currents, we found that retigabine (5 microM), an activator of KCNQ K+ channels generating neuronal M-type K+ (IM) currents, reduced GoC excitability in the threshold region. The KCNQ channel antagonist XE991 (5 microM) did not modify firing, suggesting that GoC IM has low XE991 sensitivity. Spike repolarization was followed by an after-hyperpolarization (AHP) supported by apamin-sensitive Ca2+-dependent K+ currents (I(apa)). Block of I(apa) decreased pacemaker precision without altering average frequency. We propose that feed-forward depolarization is sustained by Ih and INa,sub, and that delayed repolarizing feedback involves an IM-like current whose properties remain to be characterized. The multiple ionic mechanisms shown here to contribute to GoC pacemaking should provide the substrate for fine regulation of firing frequency and precision, thus influencing the cyclic inhibition exerted by GoCs onto the cerebellar GL.
Figures
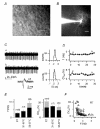
Figure 1. Spontaneous firing of cerebellar Golgi cells in loose cell-attached recordings
A, DIC-IR image of the surface of a cerebellar slice. A patch pipette is in contact with a GoC in the granular layer. Scale bar: 10 μm. B, fluorescence image of a GoC filled with Alexa Fluor 488. Note the apical dendrites extending in the molecular layer (lower part of image) and the extended plexiform axonal arborization in the granular layer (upper part). Scale bar: 20 μm C, left: loose cell-attached (LCA) current traces showing spontaneous single-spike firing at the beginning (upper trace, a) and at the end (lower trace, b) of a 30 min recording (RT). Biphasic downward and upward deflections represent spikes. Inset: single superimposed spikes from traces a and b shown at higher time resolution to illustrate constancy of spike waveform. Right, interspike interval (ISI) distributions from 1 min time windows (‘1 min ISI distributions’) including trace a (upper histogram; mean ISI and CVISI: 231 ms and 6.1%) and trace b (lower histogram; mean ISI and CVISI: 218 ms and 6.0%). D, time course of firing frequency f (top) and CVISI (bottom) for the recording shown in C. Note the low variability, and stability of f and CVISI over time. Labels indicate time position of traces a and b shown in C. E, summary of f (left) and CVISI (right) statistics for a population of 103 cells at room temperature (RT), for 17 cells at 31–33°C and for 24 cells at 35–37°C. Grey bars: mean values ±
s.e.m
.; black bars: median values. F, plot of CVISI_vs_ f for 103 cells studied at RT. Note the inverse correlation between CVISI and f (see text). All recordings in C_–_F obtained in standard extracellular solution.
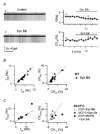
Figure 2. Rhythmic firing is resistant to block of fast synaptic inputs and mGluR and GABAB receptors
Effect of synaptic input block with NBQX (10 μ
m
),
d
-APV (25 μ
m
), SR 95531 (30 μ
m
) and strychnine (300 n
m
) (‘synaptic blockers’) and with mGluR group I/II and GABAB receptors antagonists. A, left: LCA traces showing firing activity (at RT) before (‘Control’) and after applying synaptic blockers for 6 min (‘Syn Blk’). Right: time course of firing frequency f (upper plot) and CVISI (lower plot) for the same experiment. The horizontal bars indicate time of drug application; labels indicate time position of traces a and b shown on the left. Note that firing frequency and CVISI are only marginally affected. B, plot of firing frequency and CVISI in the presence of synaptic blockers (_f_blk, CVblk), vs corresponding values before blockers (_f_ctr, CVctr) for 20 cells (RT). C, plot of firing frequency (at 35–37°C) and CVISI (_f_drug, CVdrug) in the presence of a mixture of synaptic blockers and CGP 35348 (100 μ
m
; ▵ 5 cells) (S)-MCPG (0.5 m
m
; ▪ 5 cells) and CGP 35348 + (S)-MCPG (• 4 cells), vs corresponding values in control (_f_ctr, CVctr). Firing frequency and CVISI are non-significantly affected by drug application in all cases.
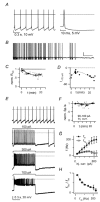
Figure 3. Whole-cell current-clamp GoC recordings
A, left: autorhythmic firing (3.7 Hz) in a GoC with synaptic blockers present. Holding current (_I_hold): 0 pA. Note the pronounced after-hyperpolarization after each spike. Horizontal bar: 0 mV level. Right: a spike from the left trace, displayed with higher time resolution. B, a longer voltage trace from another cell (_I_hold 0 pA). Note the decrease in autorhythmic firing frequency occurring in the course of a few tens of seconds. Scale bars: 5 s, 20 mV. C, summary of apparent input resistance (_R_VC) values, measured from voltage-clamp steps between −70 and −80 mV (see Methods), collected from 11 cells and plotted vs experimental time. Values are normalized to _R_VC in the first minute after break-in. D, time plot of the current injection through the patch pipette needed to maintain _V_m at ∼−70 mV (_I_−70) in a single cell. Note the initial _I_−70 increase, indicating membrane hyperpolarization, followed, after > 8 min, by progressive _I_−70 decrease, indicating subsequent depolarization. This behaviour was noticed in ∼50% of the cells. E, whole-cell (WC) current-clamp voltage traces showing responses of a GoC to 1 s-long step current injections of increasing amplitude, as indicated above traces. Top trace: _I_hold 0 pA, autorhythmic firing, 6.6 Hz. Bottom two traces: note spike frequency adaptation for large current input. Dotted bar: 0 mV level. F, number of spikes during a 1 s-long step current injection of 90–100 pA (_N_90–100), as a function of time from break-in, normalized to the value in the first minute (54 data points from 9 cells; small open circles). Average _N_90–100 (filled symbols) decreases from 12.6 ± 1.0 spikes to 12.3 ± 1.0 spikes in the first 10–15 min (−2.9 ± 4.1%). G, frequency–current (f_–_I) relationships for six cells studied as in E. _f_in (filled symbols) and _f_1s (open symbols) are plotted vs injected current (inj. curr.). _I_hold 0 pA; autorhythmic firing frequency: 3.2–7.1 Hz. H, ratio of _f_1s to _f_in, plotted vs _f_in, for the same six cells as in G. Note the progressive spike frequency adaptation with larger inputs.
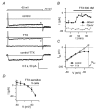
Figure 4. TTX effect on subthreshold membrane current
In voltage-clamp experiments exploring a small subthreshold voltage range TTX (500 n
m
) abolishes a steady inward component. A, current traces in response to voltage-clamp steps from −70 mV (holding potential) to −60 mV, before (top) and after TTX application (middle); the lower trace is the TTX-sensitive current, obtained from subtraction of the middle from the upper trace. Horizontal lines indicate the zero current level. The voltage protocol is shown above traces. B, for the same cell, plot of steady-state current at −70 mV (open symbols) and at the end of a 2 s step from −70 to −60 mV (filled symbols) vs experimental time. Cells used for these experiments reached a stable current baseline at −70 mV after ∼20–30 min from break-in. Bar indicates the period of TTX application. Note the TTX-induced decrease of inward current at −60 mV. Markers indicate the time of current traces reported in A. C, current–voltage relation in the −80/−55 mV range for the cell in A, before (▪) and after (○) TTX. The vertical dashed line reports the average value of GoC spike threshold (_V_thr) for reference, to show that TTX-resistant current at threshold is positive. D, average TTX-sensitive current vs voltage in the −80/−55 mV range (5 cells). Positive current at voltages ≤−70 mV might be accounted for by space-clamp errors (White et al. 1995).
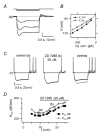
Figure 5. ZD 7288-sensitive inward rectification in GoCs
A Voltage responses to 1 s-long negative current injections (−50, −150 and −250 pA). The cell is hyperpolarized to −68 mV with −50 pA steady injection. Note the inward rectification during the step and rebound excitation after step termination. B. minimum (▴ _V_min) and steady-state (▵ _V_ss) voltage during negative step injections, plotted vs injected current, for the cell in A, to further illustrate slow inward rectification at negative potentials. C, voltage responses to 1 s-long −150 pA current injection, before and 10 min after ZD 7288 (20 μ
m
) application. Holding current: 0 pA, autorhythmic firing: 3.7 Hz (control trace), 2.5 Hz (ZD 7288 trace). D, apparent input resistance R_CC_vs experimental time, for the cell in C. _R_CC is calculated from the voltage displacement from −70 mV generated by a −150 pA injection, measured at the voltage minimum (_R_CC pk, ▵) or at the end of the step (_R_CC ss; ▪). The bar marks the period of ZD 7288 application. Note the _R_CC decrease in the control period, and the _R_CC increase induced by the drug.
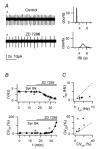
Figure 6. Block of _I_h with ZD 7288 reduces firing frequency and precision
A, left: LCA traces before (a) and after (b) bath application of 20 μ
m
ZD 7288, in the presence of synaptic blockers. Right, 1 min ISI distributions for traces on the left. Mean ISI and CVISI: 270 ms and distribution 3.6% (upper histogram) and 653 ms and 16.4% (lower histogram). B, time course of f (upper plot) and CVISI (lower plot) for the recording shown in A, indicating a large f decrease and CVISI increase during drug application. Horizontal bars indicate times of synaptic blockers and ZD 7288 application; labels indicate time position of traces a and b shown in A. C, plot of f (top) and CVISI (bottom) in the presence of ZD 7288 (_f_ZD, CVZD), vs respective values in control (_f_ctr, CVctr), for 7 cells.
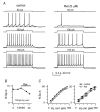
Figure 7. The M-type current agonist retigabine decreases cell excitability
A, voltage traces from a current-clamp WC recording showing responses of a GoC to 1 s-long step current injections of increasing amplitude (indicated above traces), in control (left) and 15 min after 5 μ
m
retigabine application (‘Ret’ right). Horizontal bars: −70 mV level. Note decreased spike numbers after drug for all step amplitudes B, number of spikes during a 1 s-long, 100 pA step current injection, as a function of time from break-in, for the experiment in A. The bar indicates retigabine application. C, number of spikes during a 1 s-long step current injection as a function of current amplitude, before (▪) and 15 min after retigabine application (▵). Left plot is for the same cell as above, right plot is a summary for 5 cells.
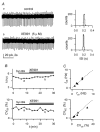
Figure 8. XE991 has no effect on autorhythmicity
A, left: LCA traces before (a) and after (b) bath application of 5 μ
m
XE991, in the presence of synaptic blockers. Right, 1 min ISI distributions for traces on the left. Mean ISI and CVISI: 202 ms and 5.9% (upper histogram) and 180 ms and 3.9% (lower histogram). B, time course of f (upper plot) and CVISI (lower plot) for the recording shown in A, indicating no major f or CVISI changes during drug application. Horizontal bars indicate times of application of synaptic blockers and XE991; labels indicate time position of traces a and b shown in A. C, plot of f (top) and CVISI (bottom) in the presence of XE991 (_f_XE, CVXE), vs respective values in control (_f_ctr, CVctr), for 5 cells.
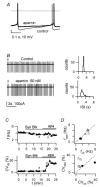
Figure 9. Control of pacemaker precision by apamin
Effects of the SK-type Ca2+-dependent K+ channel blocker apamin (50 n
m
). A, voltage traces from a WC current-clamp recording showing autorhythmic firing before (thin line) and 3 min after apamin application (thick line). Note the decrease of the spike AHP after apamin. Dotted line: 0 mV. Holding current −15 pA for both traces. B, LCA traces before (a) and during application of 50 n
m
apamin (b). Right, 1 min ISI distributions for traces on the left. Mean ISI and CVISI: 269 ms and 5.3% (upper histogram), 246 ms and 32.7% (lower histogram). Note CVISI increase induced by apamin. C, time course of f (upper plot) and CVISI (lower plot) for the recording in B. Bars indicate times of application of synaptic blockers and apamin; labels indicate time position of traces a and b shown in B. D, plot of f (top) and CVISI (bottom) in the presence of apamin (_f_apa, CVapa) vs respective values in control (_f_ctr, CVctr), for 7 cells. • indicates 2 cells with f < 2 Hz where neither f nor CVISI were affected by apamin.
Similar articles
- Hyperpolarization-activated cation channels in fast-spiking interneurons of rat hippocampus.
Aponte Y, Lien CC, Reisinger E, Jonas P. Aponte Y, et al. J Physiol. 2006 Jul 1;574(Pt 1):229-43. doi: 10.1113/jphysiol.2005.104042. Epub 2006 May 11. J Physiol. 2006. PMID: 16690716 Free PMC article. - Active Dendrites and Differential Distribution of Calcium Channels Enable Functional Compartmentalization of Golgi Cells.
Rudolph S, Hull C, Regehr WG. Rudolph S, et al. J Neurosci. 2015 Nov 25;35(47):15492-504. doi: 10.1523/JNEUROSCI.3132-15.2015. J Neurosci. 2015. PMID: 26609148 Free PMC article. - Kv7/KCNQ/M and HCN/h, but not KCa2/SK channels, contribute to the somatic medium after-hyperpolarization and excitability control in CA1 hippocampal pyramidal cells.
Gu N, Vervaeke K, Hu H, Storm JF. Gu N, et al. J Physiol. 2005 Aug 1;566(Pt 3):689-715. doi: 10.1113/jphysiol.2005.086835. Epub 2005 May 12. J Physiol. 2005. PMID: 15890705 Free PMC article. - Mechanisms of pacemaking in mammalian neurons.
Bean BP. Bean BP. J Physiol. 2024 Sep 20. doi: 10.1113/JP284759. Online ahead of print. J Physiol. 2024. PMID: 39303139 Review. - Linking oscillations in cerebellar circuits.
Courtemanche R, Robinson JC, Aponte DI. Courtemanche R, et al. Front Neural Circuits. 2013 Jul 29;7:125. doi: 10.3389/fncir.2013.00125. eCollection 2013. Front Neural Circuits. 2013. PMID: 23908606 Free PMC article. Review.
Cited by
- Identification of an inhibitory circuit that regulates cerebellar Golgi cell activity.
Hull C, Regehr WG. Hull C, et al. Neuron. 2012 Jan 12;73(1):149-58. doi: 10.1016/j.neuron.2011.10.030. Neuron. 2012. PMID: 22243753 Free PMC article. - Modeling the Cerebellar Microcircuit: New Strategies for a Long-Standing Issue.
D'Angelo E, Antonietti A, Casali S, Casellato C, Garrido JA, Luque NR, Mapelli L, Masoli S, Pedrocchi A, Prestori F, Rizza MF, Ros E. D'Angelo E, et al. Front Cell Neurosci. 2016 Jul 8;10:176. doi: 10.3389/fncel.2016.00176. eCollection 2016. Front Cell Neurosci. 2016. PMID: 27458345 Free PMC article. Review. - Modeling Neurotransmission: Computational Tools to Investigate Neurological Disorders.
Gandolfi D, Boiani GM, Bigiani A, Mapelli J. Gandolfi D, et al. Int J Mol Sci. 2021 Apr 27;22(9):4565. doi: 10.3390/ijms22094565. Int J Mol Sci. 2021. PMID: 33925434 Free PMC article. Review. - Electrophysiological, morphological, and topological properties of two histochemically distinct subpopulations of cerebellar unipolar brush cells.
Kim JA, Sekerková G, Mugnaini E, Martina M. Kim JA, et al. Cerebellum. 2012 Dec;11(4):1012-25. doi: 10.1007/s12311-012-0380-8. Cerebellum. 2012. PMID: 22528965 Free PMC article. - Probabilistic identification of cerebellar cortical neurones across species.
Van Dijck G, Van Hulle MM, Heiney SA, Blazquez PM, Meng H, Angelaki DE, Arenz A, Margrie TW, Mostofi A, Edgley S, Bengtsson F, Ekerot CF, Jörntell H, Dalley JW, Holtzman T. Van Dijck G, et al. PLoS One. 2013;8(3):e57669. doi: 10.1371/journal.pone.0057669. Epub 2013 Mar 4. PLoS One. 2013. PMID: 23469215 Free PMC article.
References
- Beurrier C, Bioulac B, Hammond C. Slowly inactivating sodium current (I(NaP) underlies single-spike activity in rat subthalamic neurons. J Neurophysiol. 2000;83:1951–1957. - PubMed
- Brown DA, Adams PR. Muscarinic suppression of a novel voltage-sensitive K+ current in a vertebrate neuron. Nature. 1980;283:673–676. - PubMed
- Brown BS, Yu SP. Modulation and genetic identification of the M-channel. Prog Biophys Mol Biol. 2000;73:135–166. - PubMed
Publication types
MeSH terms
Substances
LinkOut - more resources
Full Text Sources
Research Materials
Miscellaneous
