Single-cell chromosomal imbalances detection by array CGH - PubMed (original) (raw)
Claudia Spits, Karen Sermon, Martine De Rycke, Bernard Thienpont, Sophie Debrock, Catherine Staessen, Yves Moreau, Jean-Pierre Fryns, Andre Van Steirteghem, Inge Liebaers, Joris R Vermeesch
Affiliations
- PMID: 16698960
- PMCID: PMC3303179
- DOI: 10.1093/nar/gkl336
Single-cell chromosomal imbalances detection by array CGH
Cedric Le Caignec et al. Nucleic Acids Res. 2006.
Abstract
Genomic imbalances are a major cause of constitutional and acquired disorders. Therefore, aneuploidy screening has become the cornerstone of preimplantation, prenatal and postnatal genetic diagnosis, as well as a routine aspect of the diagnostic workup of many acquired disorders. Recently, array comparative genomic hybridization (array CGH) has been introduced as a rapid and high-resolution method for the detection of both benign and disease-causing genomic copy-number variations. Until now, array CGH has been performed using a significant quantity of DNA derived from a pool of cells. Here, we present an array CGH method that accurately detects chromosomal imbalances from a single lymphoblast, fibroblast and blastomere within a single day. Trisomy 13, 18, 21 and monosomy X, as well as normal ploidy levels of all other chromosomes, were accurately determined from single fibroblasts. Moreover, we showed that a segmental deletion as small as 34 Mb could be detected. Finally, we demonstrated the possibility to detect aneuploidies in single blastomeres derived from preimplantation embryos. This technique offers new possibilities for genetic analysis of single cells in general and opens the route towards aneuploidy screening and detection of unbalanced translocations in preimplantation embryos in particular.
Figures
Figure 1
(A–D) Examples of single-cell array CGH profiles performed on aneuploid cell lines. For each panel, the _x_-axis represents the 22 autosomes, followed by the X and Y chromosomes. The _y_-axis marks the log2 mean ratios of all spots of each chromosome. Following ϕ29 DNA polymerase amplification, single cells containing trisomy 13 (A), 18 (B) and 21 (C) were hybridized versus non-amplified gDNA of the opposite sex, and monosomic X single cell (D) versus non-amplified XX gDNA. The checked columns represent the abnormal chromosomes.
Figure 2
Overview of single-cell experiments performed on aneuploid cell lines and analysis using chromosome-specific threshold. The closed circles represent the mean intensity ratios of chromosomes 13, 18 and 21 of each respective trisomy cell line. The open circles represent the mean intensity ratios of X and Y chromosomes of monosomy X cell line. The _x_-axis represents the 22 autosomes, the X and Y chromosomes. The _y_-axis marks the log2 mean ratio of the 18 single-cell experiments for each chromosome. The grey columns represent the mean ratios of the 18 experiments of each chromosome plus or minus three times the standard deviation representing the chromosome-specific threshold.
Figure 3
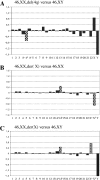
(A–C) Examples of single-cell array CGH profiles performed on cell lines containing a segmental deletion and/or duplication. (A) Following ϕ29 DNA polymerase amplification, single cells containing an interstitial 4q deletion were hybridized versus non-amplified gDNA of the opposite sex. The _y_-axis marks the log2 mean ratios of all spots of each chromosome. The _x_-axis represents the 22 autosomes, followed by the X and Y chromosomes. Chromosome 4 was divided in three regions: 4a represented the region from the subtelomere 4p to the centromeric breakpoint of the deletion (59.8 Mb), 4b corresponded to the 4q deletion (34 Mb) and 4c the region from the distal breakpoint of the deletion to the subtelomere 4q (97.6 Mb). The deleted region (4b) showed the expected log2 mean ratio. (B and C) Following ϕ29 DNA polymerase amplification, single cells containing an unbalanced reciprocal translocation involving chromosomes X and 14 were hybridized versus non-amplified 46,XX and 46,XY gDNA. The _y_-axis marks the log2 mean ratios of all spots of each chromosome. Chromosome 14 was divided in two regions: 14a represented the region from the centromere to the breakpoint of the translocation (59.4 Mb), 14b corresponded to the 14q duplication (47 Mb). Chromosome X was divided in two regions: Xa represented the region from the subtelomere Xp to the breakpoint of the translocation (59.7 Mb) and Xb corresponded to the Xq deletion. When hybridized versus female gDNA (B), a deletion of Xb was expected, whereas hybridised versus male gDNA (C), a log2 mean ratio corresponding to a duplication of Xa was expected. The checked columns represent the 4q- and the Xq-deleted regions and the 14q-duplicated region.
Figure 4
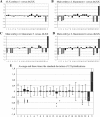
(A–D) Examples of single-cell array CGH profiles performed on blastomeres. For each, the _x_-axis represents the 22 autosomes, followed by the X and Y chromosomes. The _y_-axis marks the log2 mean ratios of all spots of each chromosome. The checked columns represent the abnormal chromosomes. Following ϕ29 DNA polymerase amplification, (A) one blastomere of embryo 1 was hybridized versus non-amplified female gDNA, (B and D) three blastomeres of embryo 2 versus non-amplified female gDNA. (E) Overview of single-cell experiments performed on embryo 2. The closed circles represent the mean intensity ratios of abnormal chromosomes identified. The _x_-axis represents the 22 autosomes, the X and Y chromosomes. The _y_-axis marks the log2 mean ratios of the 12 single-cell experiments of each chromosome. The grey columns represent the mean ratios of the 12 experiments of each chromosome plus or minus three times the standard deviation used for the chromosome-specific threshold.
Similar articles
- Oligonucleotide arrays vs. metaphase-comparative genomic hybridisation and BAC arrays for single-cell analysis: first applications to preimplantation genetic diagnosis for Robertsonian translocation carriers.
Ramos L, del Rey J, Daina G, García-Aragonés M, Armengol L, Fernandez-Encinas A, Parriego M, Boada M, Martinez-Passarell O, Martorell MR, Casagran O, Benet J, Navarro J. Ramos L, et al. PLoS One. 2014 Nov 21;9(11):e113223. doi: 10.1371/journal.pone.0113223. eCollection 2014. PLoS One. 2014. PMID: 25415307 Free PMC article. - Detection of ≥1Mb microdeletions and microduplications in a single cell using custom oligonucleotide arrays.
Bi W, Breman A, Shaw CA, Stankiewicz P, Gambin T, Lu X, Cheung SW, Jackson LG, Lupski JR, Van den Veyver IB, Beaudet AL. Bi W, et al. Prenat Diagn. 2012 Jan;32(1):10-20. doi: 10.1002/pd.2855. Prenat Diagn. 2012. PMID: 22470934 - [First experiences with preimplantation genetic screening of chromosomal aberrations using oligonucleotide-based array comparative genomic hybridization].
Kuglík P, Smetana J, Němcová D, Vallová V, Mikulášová A, Gaillyová R, Hubinka V, Koudelka M. Kuglík P, et al. Cas Lek Cesk. 2015;154(3):127-31. Cas Lek Cesk. 2015. PMID: 26311028 Czech. - Preimplantation genetic diagnosis and chromosome analysis of blastomeres using comparative genomic hybridization.
Wilton L. Wilton L. Hum Reprod Update. 2005 Jan-Feb;11(1):33-41. doi: 10.1093/humupd/dmh050. Epub 2004 Nov 29. Hum Reprod Update. 2005. PMID: 15569702 Review. - Detection of segmental aneuploidy and mosaicism in the human preimplantation embryo: technical considerations and limitations.
Treff NR, Franasiak JM. Treff NR, et al. Fertil Steril. 2017 Jan;107(1):27-31. doi: 10.1016/j.fertnstert.2016.09.039. Epub 2016 Nov 2. Fertil Steril. 2017. PMID: 27816233 Review.
Cited by
- New array approaches to explore single cells genomes.
Vanneste E, Bittman L, Van der Aa N, Voet T, Vermeesch JR. Vanneste E, et al. Front Genet. 2012 Mar 27;3:44. doi: 10.3389/fgene.2012.00044. eCollection 2012. Front Genet. 2012. PMID: 22509179 Free PMC article. - Single-cell whole-genome amplification technique impacts the accuracy of SNP microarray-based genotyping and copy number analyses.
Treff NR, Su J, Tao X, Northrop LE, Scott RT Jr. Treff NR, et al. Mol Hum Reprod. 2011 Jun;17(6):335-43. doi: 10.1093/molehr/gaq103. Epub 2010 Dec 21. Mol Hum Reprod. 2011. PMID: 21177337 Free PMC article. - Tracing the tumor lineage.
Navin NE, Hicks J. Navin NE, et al. Mol Oncol. 2010 Jun;4(3):267-83. doi: 10.1016/j.molonc.2010.04.010. Epub 2010 May 5. Mol Oncol. 2010. PMID: 20537601 Free PMC article. - Reliable single cell array CGH for clinical samples.
Czyż ZT, Hoffmann M, Schlimok G, Polzer B, Klein CA. Czyż ZT, et al. PLoS One. 2014 Jan 21;9(1):e85907. doi: 10.1371/journal.pone.0085907. eCollection 2014. PLoS One. 2014. PMID: 24465780 Free PMC article. - Chromosome instability is common in human cleavage-stage embryos.
Vanneste E, Voet T, Le Caignec C, Ampe M, Konings P, Melotte C, Debrock S, Amyere M, Vikkula M, Schuit F, Fryns JP, Verbeke G, D'Hooghe T, Moreau Y, Vermeesch JR. Vanneste E, et al. Nat Med. 2009 May;15(5):577-83. doi: 10.1038/nm.1924. Epub 2009 Apr 26. Nat Med. 2009. PMID: 19396175
References
- Wilton, L. 2002. Preimplantation genetic diagnosis for aneuploidy screening in early human embryos: a review Prenat. Diagn. 22312–318 - PubMed
- Sermon, K., Van Steirteghem, A., Liebaers, I. 2004. Preimplantation genetic diagnosis Lancet 3631633–1641 - PubMed
- Wilton, L. 2005. Preimplantation genetic diagnosis and chromosome analysis of blastomeres using comparative genomic hybridization Hum. Reprod. Update 1133–41 - PubMed
- Solinas-Toldo, S., Lampel, S., Stilgenbauer, S., Nickolenko, J., Benner, A., Dohner, H., Cremer, T., Lichter, P. 1997. Matrix-based comparative genomic hybridization: biochips to screen for genomic imbalances Genes Chromosomes Cancer 20399–407 - PubMed
Publication types
MeSH terms
Substances
LinkOut - more resources
Full Text Sources
Other Literature Sources
Medical
Molecular Biology Databases
Miscellaneous


