Differential compartmentalization and distinct functions of GABAB receptor variants - PubMed (original) (raw)
. 2006 May 18;50(4):589-601.
doi: 10.1016/j.neuron.2006.04.014.
Samuel Barbieri, Hans Bräuner-Osborne, Rostislav Turecek, Ryuichi Shigemoto, Yan-Ping Zhang, Rafael Luján, Laura H Jacobson, Barbara Biermann, Jean-Marc Fritschy, Claire-Marie Vacher, Matthias Müller, Gilles Sansig, Nicole Guetg, John F Cryan, Klemens Kaupmann, Martin Gassmann, Thomas G Oertner, Bernhard Bettler
Affiliations
- PMID: 16701209
- PMCID: PMC3531664
- DOI: 10.1016/j.neuron.2006.04.014
Differential compartmentalization and distinct functions of GABAB receptor variants
Réjan Vigot et al. Neuron. 2006.
Abstract
GABAB receptors are the G protein-coupled receptors for the main inhibitory neurotransmitter in the brain, gamma-aminobutyric acid (GABA). Molecular diversity in the GABAB system arises from the GABAB1a and GABAB1b subunit isoforms that solely differ in their ectodomains by a pair of sushi repeats that is unique to GABAB1a. Using a combined genetic, physiological, and morphological approach, we now demonstrate that GABAB1 isoforms localize to distinct synaptic sites and convey separate functions in vivo. At hippocampal CA3-to-CA1 synapses, GABAB1a assembles heteroreceptors inhibiting glutamate release, while predominantly GABAB1b mediates postsynaptic inhibition. Electron microscopy reveals a synaptic distribution of GABAB1 isoforms that agrees with the observed functional differences. Transfected CA3 neurons selectively express GABAB1a in distal axons, suggesting that the sushi repeats, a conserved protein interaction motif, specify heteroreceptor localization. The constitutive absence of GABAB1a but not GABAB1b results in impaired synaptic plasticity and hippocampus-dependent memory, emphasizing molecular differences in synaptic GABAB functions.
Figures
Figure 1. Generation of _1a_−/− and _1b_−/− Mice
(A) 5′ region of wild-type (WT) (Martin et al., 2001) and mutated GABAB1 alleles. Exons encoding the N terminus of GABAB1a are represented by white boxes and specify the signal peptide (exon 2a), a pair of sushi repeats of 75 amino acids each (exons 3a, 4a), and a linker of six amino acids (exon 5a). The exon specifying the N terminus of GABAB1b is represented by a gray box. All exons downstream of exon 1b are shared between the two isoforms (only exon 6 is shown; hatched box). Start codons for GABAB1a (Ma) and GABAB1b (Mb) transcripts were converted into stop codons (S) using a knockin approach. A putative alternative start site (Ma*) in GABAB1a transcripts was mutated in addition. The floxed neomycin cassette (black bar) for selection of transfected embryonic stem cells was introduced in the introns between exons 2a/3a (_1a_−/−neo) or exons 5a/1b (_1b_−/−neo). A loxP site (arrow) is left behind after Cre-mediated excision of the neomycin cassette (_1a_−/−, _1b_−/−). (B) Northern blot analysis of GABAB1a and GABAB1b mRNA expression in the brain of WT, heterozygous (+/−), and homozygous (−/−) knockout mice. The 1a hybridization probe (1a probe) corresponds to nucleotides 1–405 of the GABAB1a cDNA (Kaupmann et al., 1997) and detects GABAB1a as well as a truncated GABAB1j transcript (M.G., unpublished data) of ~1.6 kb (upper panel). The 1b probe corresponds to nucleotides 16–259 of the GABAB1b cDNA (Kaupmann et al., 1997) and detects 1b transcripts (lower panel). (C) Immunoblot analysis of total brain lysates using antibodies recognizing the common C terminus of GABAB1a and GABAB1b (AB1ab) (Gassmann et al., 2004). Anti-syntaxin (ABstx) antibodies control for sample loading.
Figure 2. Distribution of GABAB1a and GABAB1b Protein in the Hippocampus of _1a_−/− and _1b_−/− Mice
Immunohistochemistry in the CA1/CA3 region using antibodies specific for GABAB1 (AB1ab, recognizing an epitope shared by GABAB1a and GABAB1b), GABAB1b (AB1b), and GABAB2 (AB2). No GABAB1a-specific antibody suitable for immunohistochemistry is available. The expression pattern of GABAB1a protein is revealed in _1b_−/− mice stained with AB1ab. No specific immunostaining is observed with AB1b in _1b_−/− mice, demonstrating the specificity of this antibody for GABAB1b protein. No specific immunostaining was obtained in control experiments with AB1ab/AB1b and AB2 antibodies in mice devoid of GABAB1 and GABAB2 subunits, respectively (Fritschy et al., 2004). Abbreviations: so, stratum oriens; sl, stratum lucidum; sr, stratum radiatum; slm, stratum lacunosum-moleculare. Scale bar, 200 μm. The WT mouse was a littermate of the _1a_−/− mouse.
Figure 3. Pharmacological and Biochemical Analysis of Brain Membranes from Wild-Type, _1a_−/−, and _1b_−/− Mice
(A) Inhibition of [125I]CGP64213 GABAB antagonist binding to cortical membranes by the agonists GABA and L-baclofen (L-Bac). The curves were fitted using nonlinear regression (Graph Pad PRISM program, Graph Pad software Inc., San Diego). Error bars (±SEM) are smaller than the symbols. (B) Binding of [3H]baclofen to cortical membranes of _1a_−/− and _1b_−/− mice was 57% ± 2% and 50% ± 7%, respectively, of the binding to WT membranes (±SEM of two independent experiments performed in triplicate). (C) GABA-stimulated GTPγ[35S] binding in cortical membranes. Data points are mean (±SEM) values calculated from five (WT) and four (_1a_−/−, _1b_−/−, 1−/−) mice.
Figure 4. GABAB Responses in Wild-Type, _1a_−/−, and _1b_−/− CA1 Pyramidal Neurons
(A and B) Peak amplitudes and representative traces (A) and summary histogram (B) of monosynaptic EPSC inhibition by baclofen and adenosine. Baclofen (50 μM) depresses the amplitude of EPSCs in WT (76.5% ± 3.1% inhibition; n = 8) and _1b_−/− (83.4% ± 2.9% inhibition; n = 5) but not in _1a_−/− (15.9% ± 5.3% inhibition; n = 13; p < 0.001, ANOVA/Scheffe post hoc test) mice. Adenosine (100 μM) depresses EPSCs in all genotypes (WT: 89.1% ± 1.6% inhibition, n = 6; _1a_−/−: 85.3% ± 1.8% inhibition, n = 13; _1b_−/−: 85.6% ± 6.6% inhibition, n = 4). (C and D) Peak amplitudes and representative traces (C) and summary histogram (D) of IPSC inhibition by baclofen. Baclofen significantly depresses the IPSC amplitude in all genotypes (WT: 82.7% ± 4.8% inhibition, n = 12; _1a_−/−: 71.8% ± 2.3% inhibition, n = 9; _1b_−/− mice: 85.7% ± 2.4% inhibition, n = 7). (E and F) Representative changes in the holding current of CA1 neurons following application of baclofen and adenosine (E) and summary histogram of the amplitude of baclofen- and adenosine-induced K+ currents (F). The amplitude of the outward K+ current induced by baclofen application is similar in _1a_−/− (99.3 ± 8.8 pA; n = 14) and WT (89.8 ± 7.7 pA; n = 16) neurons. In _1b_−/− cells, the amplitude of the baclofen-induced current is strongly reduced (37.4 ± 2.7 pA; n = 10; p < 0.001, ANOVA/Scheffe post hoc test). Control adenosine-induced K+ currents are similar in all genotypes. (Vclamp: −50 mV, TTX 1 μM, ***p < 0.001, ANOVA/Scheffe post hoc test). All baclofen-induced responses (inhibition of PSCs and activation of K+ currents) were fully blocked by the GABAB antagonist CGP54626 (1 μM). Values are expressed as mean ± SEM.
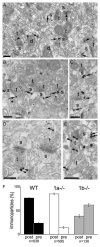
Figure 5. Preembedding Electron Micrographs Showing GABAB1 Immunogold Labeling at Asymmetrical, i.e. Glutamatergic, Synapses in CA1 Stratum Radiatum
(A) Pre- and postsynaptic immunogold labeling in WT mice. (B and C) Predominant postsynaptic (B) and rare presynaptic (C) labeling (arrowhead) in _1a_−/− mice. (D and E) Predominant presynaptic (D) and less frequent postsynaptic (E) labeling in _1b_−/− mice. (F) Percentage of pre- and postsynaptic immunogold particles in WT, _1a_−/−, and _1b_−/− mice (presynaptic: WT, 24% ± 1%; _1a_−/−, 14% ± 3%; _1b_−/−, 62% ± 4%; n = 3 for each genotype; mean ± SEM). Immunogold labeling was less frequent in _1b_−/− compared to _1a_−/− mice, which is reflected in the number of immunogold particles that were analyzed. Arrow: examples of immunogold particles in spines and dendritic shafts; arrowhead: examples of immunogold particles in presynaptic terminals. t, terminal; s, spine; d, dendrite; scale bars, 200 nm.
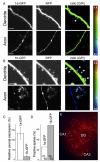
Figure 6. Expression of GFP-TaggedGABAB1a and GABAB1b Subunits in Organotypic Slice Culture
Maximum intensity projections of dendrites and axons in the CA1 region of the hippocampus expressing GABAB1a-GFP (A) or GABAB1b-GFP (B) in combination with the freely diffusible tdimer2 RFP are shown. The ratio of green-to-red fluorescence (G/R) is coded in rainbow colors. Scale bar, 5 μm. (C) Predominantly GABAB1a-GFP protein is expressed in axons. The axonal expression level of GABAB1a and GABAB1b was normalized to the dendritic expression level (GABAB1a: 133.84% ± 29.53%, n = 9; GABAB1b: 18.01% ± 2.80%, n = 5; mean ± SEM). (D) GABAB1b-GFP was expressed in the majority of dendritic spines, while GABAB1a-GFP was excluded from most spines (spines positive for GABAB1a-GFP: 21 of 82; spines positive for GABAB1b-GFP: 42 of 62). Examples of positive spines are indicated by white arrowheads in the G/R ratio images in (A) and (B). (E) Example of an organotypic hippocampal slice culture 7 days after cotransfection of GABAB1b-GFP and tdimer2 expression vectors.
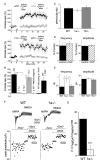
Figure 7. Lack of LTP and Reduction in the Proportion of Silent Synapses in _1a_−/− Mice
(A) The pairing protocol fails to induce LTP in 1−/− and _1a_−/− mice but induces a clear potentiation of the EPSC amplitude in WT and _1b_−/− mice. Averages of the maximal EPSC amplitudes (±SEM) are shown. Pairing induction is indicated with an arrow. (Insets) Mean of 10 to 15 successive EPSCs recorded before and after pairing. Scale, 20 ms, 50 pA. (B) Summary histogram of LTP experiments. The percent increase in EPSC amplitude after pairing is shown. Values for EPSC potentiation were assessed 25 min after induction. No LTP is induced in WT mice in the presence of NMDA antagonists (5 μM R-CPP + 10 μM 7-Cl-kynurenate; WT + NMDA antagonist; p < 0.001 compared to WT, Student’s t test) and in the absence of paradigm-associated depolarization (WT with pairing at −70 mV; p < 0.05 compared to WT, Student’s t test). LTP is not significantly impaired in the presence of 1 μM CGP54626 (WT +CGP). The ANOVA/Scheffe post hoc test was used for the comparison of genotypes. For clarity, only the statistical significance between the genotypes linked by the brackets are shown (*p < 0.05; **p < 0.01; ***p < 0.001). (C) The pairedpulse ratio of EPSCs at CA3-to-CA1 synapses in WT (2.54 ± 0.11; n = 15), _1a_−/− (2.27 ± 0.16; n = 15) and _1b_−/− (2.64 ± 0.28; n = 8) mice was similar. (D) The GABAB antagonist CGP54626 (1 μM) did not alter mEPSC frequency (increase of 13.6% ± 15.3% versus control; n = 11) or amplitude (increase of 4.3% ± 5.1%; n = 11) in WT mice. (E) The frequency of mEPSCs was increased in _1a_−/− mice (WT: 0.44 ± 0.05 Hz, n = 11; _1a_−/−: 0.90 ± 0.14 Hz, n = 15; _1b_−/−: 0.49 ± 0.09 Hz, n = 8; p < 0.05, Student’s t test). In contrast, the mEPSC amplitude did not differ between WT (16.39 ± 0.79 pA; n = 11), _1a_−/− (17.12 ± 0.78 pA; n = 18), and _1b_−/− (15.68 ± 0.88 pA; n = 8) mice. (F) Raw traces of AMPA and NMDA receptor-mediated EPSCs components (top). The protocol used to determine the CVAMPA and CVNMDA is outlined. At −70 mV, NMDA receptors are blocked by Mg2+ ions, and the EPSCs are primarily mediated by AMPA receptors. NMDA receptor-mediated EPSCs were recorded in the same cell at +30 mV in the presence of 10 μM DNQX, a non-NMDA receptor antagonist. (G) The variability of the AMPA compared to the NMDA EPSC component (calculated as [1 – (CVNMDA/CVAMPA)] × 100) is significantly smaller in _1a_−/− than in WT mice (WT: 34.0 ± 5.0, n = 12; _1a_−/−: 5.6 ± 3.9, n = 10; p < 0.01, Student’s t test), suggestive of a decreased proportion of silent synapses. WT mice were littermates of _1a_−/− mice. Data are represented as mean ± SEM.
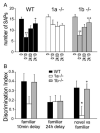
Figure 8. Impaired Object Recognition in _1a_−/− Mice
(A) Data represent the number of SAPs (mean ± SEM) to a PVC disc presented at time 0 min (0), 10 min (0:10), and 24 hr (24:00), and to a novel PVC cone at 24 hr + 10 min (24:10). **p < 0.01 versus 0 min; +p < 0.05 versus 10 min; ++p < 0.01 versus 10 min. _1a_−/− mice do not discriminate between familiar and novel objects (χ2 = 5.824, 3 df, p = 0.121), in contrast to WT (χ2 = 13.80, 3 df, p = 0.003) and _1b_−/− mice (χ2 = 23.016, 3 df, p < 0.001). This deficit of _1a_−/− mice was also evident in a separate cohort of mice (data not shown). (B) Discrimination indices (DIs; mean ± SEM) in the object recognition test for WT, _1a_−/−, and _1b_−/− mice. Time points for calculating DIs were chosen to reflect the following: short-term memory of a familiar object (familiar 10 min delay), long-term memory of a familiar object (familiar 24 hr delay), and short-term discriminative memory between a novel and familiar object (novel versus familiar). The mean DI for discrimination of a familiar object after 10 min delay appeared to be lower in _1a_−/− mice but failed to meet statistical significance [DI: F(2, 26) = 2.006; p = 0.149]. However, the decrease in the mean DI for discrimination of a novel versus a familiar object is significantly lower in _1a_−/− mice than in _1b_−/− or WT mice [F(2, 26) = 4.404; p = 0.023]. After a delay of 24 hr, the three genotypes similarly demonstrated a lack of familiarity with the previously presented disc [DI: F(2, 26) = 0.001; p = 0.999]. *p = 0.05 versus WT; +p < 0.05 versus _1a_−/−.
Comment in
- GABAB receptor isoforms caught in action at the scene.
Huang ZJ. Huang ZJ. Neuron. 2006 May 18;50(4):521-4. doi: 10.1016/j.neuron.2006.05.005. Neuron. 2006. PMID: 16701201 Review.
Similar articles
- Presynaptic GABAB Receptors Regulate Hippocampal Synapses during Associative Learning in Behaving Mice.
Jurado-Parras MT, Delgado-García JM, Sánchez-Campusano R, Gassmann M, Bettler B, Gruart A. Jurado-Parras MT, et al. PLoS One. 2016 Feb 5;11(2):e0148800. doi: 10.1371/journal.pone.0148800. eCollection 2016. PLoS One. 2016. PMID: 26848590 Free PMC article. - Blunted 5-HT1A receptor-mediated responses and antidepressant-like behavior in mice lacking the GABAB1a but not GABAB1b subunit isoforms.
Jacobson LH, Hoyer D, Fehlmann D, Bettler B, Kaupmann K, Cryan JF. Jacobson LH, et al. Psychopharmacology (Berl). 2017 May;234(9-10):1511-1523. doi: 10.1007/s00213-016-4521-5. Epub 2017 Jan 9. Psychopharmacology (Berl). 2017. PMID: 28070618 - Reduction in the neuronal surface of post and presynaptic GABAB receptors in the hippocampus in a mouse model of Alzheimer's disease.
Martín-Belmonte A, Aguado C, Alfaro-Ruíz R, Moreno-Martínez AE, de la Ossa L, Martínez-Hernández J, Buisson A, Früh S, Bettler B, Shigemoto R, Fukazawa Y, Luján R. Martín-Belmonte A, et al. Brain Pathol. 2020 May;30(3):554-575. doi: 10.1111/bpa.12802. Epub 2019 Dec 12. Brain Pathol. 2020. PMID: 31729777 Free PMC article. - GABAB receptors: modulation of thalamocortical dynamics and synaptic plasticity.
Sanchez-Vives MV, Barbero-Castillo A, Perez-Zabalza M, Reig R. Sanchez-Vives MV, et al. Neuroscience. 2021 Feb 21;456:131-142. doi: 10.1016/j.neuroscience.2020.03.011. Epub 2020 Mar 17. Neuroscience. 2021. PMID: 32194227 Review. - GABAB receptor isoforms caught in action at the scene.
Huang ZJ. Huang ZJ. Neuron. 2006 May 18;50(4):521-4. doi: 10.1016/j.neuron.2006.05.005. Neuron. 2006. PMID: 16701201 Review.
Cited by
- Dynamics of the mouse brain cortical synaptic proteome during postnatal brain development.
Gonzalez-Lozano MA, Klemmer P, Gebuis T, Hassan C, van Nierop P, van Kesteren RE, Smit AB, Li KW. Gonzalez-Lozano MA, et al. Sci Rep. 2016 Oct 17;6:35456. doi: 10.1038/srep35456. Sci Rep. 2016. PMID: 27748445 Free PMC article. - Molecular mechanism of secreted amyloid-β precursor protein in binding and modulating GABABR1a.
Feng M, Song Y, Chen SH, Zhang Y, Zhou R. Feng M, et al. Chem Sci. 2021 Mar 16;12(17):6107-6116. doi: 10.1039/d0sc06946a. Chem Sci. 2021. PMID: 33996007 Free PMC article. - Nanoscale alterations in GABAB receptors and GIRK channel organization on the hippocampus of APP/PS1 mice.
Martín-Belmonte A, Aguado C, Alfaro-Ruiz R, Moreno-Martínez AE, de la Ossa L, Aso E, Gómez-Acero L, Shigemoto R, Fukazawa Y, Ciruela F, Luján R. Martín-Belmonte A, et al. Alzheimers Res Ther. 2022 Sep 21;14(1):136. doi: 10.1186/s13195-022-01078-5. Alzheimers Res Ther. 2022. PMID: 36131327 Free PMC article. - Deficits in emotional learning and memory in an animal model of schizophrenia.
Bolton MM, Heaney CF, Sabbagh JJ, Murtishaw AS, Magcalas CM, Kinney JW. Bolton MM, et al. Behav Brain Res. 2012 Jul 15;233(1):35-44. doi: 10.1016/j.bbr.2012.04.049. Epub 2012 May 5. Behav Brain Res. 2012. PMID: 22569573 Free PMC article. - Different transmitter transients underlie presynaptic cell type specificity of GABAA,slow and GABAA,fast.
Szabadics J, Tamás G, Soltesz I. Szabadics J, et al. Proc Natl Acad Sci U S A. 2007 Sep 11;104(37):14831-6. doi: 10.1073/pnas.0707204104. Epub 2007 Sep 4. Proc Natl Acad Sci U S A. 2007. PMID: 17785408 Free PMC article.
References
- Bettler B, Kaupmann K, Mosbacher J, Gassmann M. Molecular structure and physiological functions of GABA(B) receptors. Physiol. Rev. 2004;84:835–867. - PubMed
- Bischoff S, Leonhard S, Reymann N, Schuler V, Shigemoto R, Kaupmann K, Bettler B. Spatial distribution of GABABR1 receptor mRNA and binding sites in the rat brain. J. Comp. Neurol. 1999;412:1–16. - PubMed
- Blein S, Ginham R, Uhrin D, Smith BO, Soares DC, Veltel S, McIlhinney RA, White JH, Barlow PN. Structural analysis of the complement control protein (CCP) modules of GABA(B) receptor 1a: only one of the two CCP modules is compactly folded. J. Biol. Chem. 2004;279:48292–48306. - PubMed
- Bonanno G, Raiteri M. Multiple GABAB receptors. Trends Pharmacol. Sci. 1993;14:259–261. - PubMed
Publication types
MeSH terms
Substances
LinkOut - more resources
Full Text Sources
Other Literature Sources
Molecular Biology Databases
Miscellaneous


