Transcriptional pulsing of a developmental gene - PubMed (original) (raw)
Transcriptional pulsing of a developmental gene
Jonathan R Chubb et al. Curr Biol. 2006.
Abstract
It has not been possible to view the transcriptional activity of a single gene within a living eukaryotic cell. It is therefore unclear how long and how frequently a gene is actively transcribed, how this is modulated during differentiation, and how transcriptional events are dynamically coordinated in cell populations. By means of an in vivo RNA detection technique , we have directly visualized transcription of an endogenous developmental gene. We found discrete "pulses" of gene activity that turn on and off at irregular intervals. Surprisingly, the length and height of these pulses were consistent throughout development. However, there was strong developmental variation in the proportion of cells recruited to the expressing pool. Cells were more likely to re-express than to initiate new expression, indicating that we directly observe a transcriptional memory. In addition, we used a clustering algorithm to reveal synchronous transcription initiation in neighboring cells. This study represents the first direct visualization of transcriptional pulsing in eukaryotes. Discontinuity of transcription may allow greater flexibility in the gene-expression decisions of a cell.
Figures
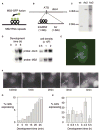
Figure 1. Visualizing Transcription of a Developmental Gene in Living Cells
(A) Schematic for RNA detection system. (B) Schematic for detection of expression of dscA gene. (C) Southern analysis of dscA-MS2 knockin cell lines. Extra wild-type band for AX3 corresponds to wild-type gene on duplicated portion of chromosome 2. (D) Northern analysis of dscA-MS2 cells demonstrating appropriate induction by starvation (left) and high culture density during growth (right). The MS2 RNA runs as a single major band at 1.5 kb. (E) Transformation of MS2-GFP into dscA-MS2 cells reveals a single nuclear spot in expressing cells (arrow). (F) Visualizing the induction of dscA transcription (arrows, maximal projection of 3D stacks). (G) Increase in the proportion of expressing cells during the first 30 min of differentiation. (H) Developmental variation in the proportion of expressing cells. Data are from 30 min movies commencing at the indicated times. 30–40 movies (n = 1500–2000 cells) were collected over 3–4 experimental days for each time point (bars indicate standard deviation).
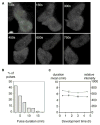
Figure 2. Variation in the Length of Transcriptional Pulses
(A) Variation in pulse duration. The top cell has a visible transcriptional event for 4 frames (10 min), whereas the neighboring lower cell expresses for only 2 frames (maximal projection). (B) Distribution of pulse durations for the 0.5 hr time point. Shorter pulses are more common. (C) Developmental profile of mean pulse duration (filled symbols) and intensity (open symbols). Pulse duration and intensity are not subject to major developmental variation (bars reflect standard error).
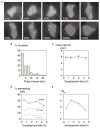
Figure 3. Transcription Is Discontinuous
(A) Multiple pulses of dscA transcription. The central cell initially transcribes for 5 frames, then is inactive for 3 frames before reinitiating and expressing for a further 2 frames (maximal projection). (B) Variation in pulse spacing. The plot displays the spacing (interval) between pulses for all cells in the 0.5 hr time point. (C) The mean interval between pulses is approximately 6 min and is not subject to large developmental variation (bars reflect standard error). (D) Developmental profile of pulse frequency (pulses per 30 min movie). Cells were scored for 1, 2, or 3+ pulses, at the indicated developmental times. There is significant variation between the proportions of the different pulse classes between 0.5 hr and 4.5 hr time points (χ2: p < 0.001). (E) High tendency for reinitiation is observed at time points where low numbers of cells express. Ratio of the probability of a second pulse to the probability of the first (Rm) plotted against developmental time. The expected Rm value is 1 in a situation where reinitiation is not favored over de novo transcription. Cells at the 1.5 hr and 3 hr time points have a significant elevation of Rm over expected levels (χ2: p < 0.001) and are significantly different from the 4.5 hr time point (χ2: p < 0.001).
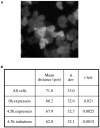
Figure 4. Expression of dscA in Cell Clusters
(A) Example image of the expression of dscA restricted to neighboring cells (maximal projection). (B) Significant clustering of dscA expressers. Pairwise distances between all transcription sites in a field were compared with pairwise distances between the centroids of all the cells (>105total cell:cell comparisons) in a field. These data were analyzed from cells at the onset of differentiation (0 hr) and preaggregation (4.5 hr). Most significant clustering was detected when only the initiating frame of the pulse was used, suggestive of coordinated transcription induction.
Comment in
- Eukaryotic transcription: what does it mean for a gene to be 'on'?
Golding I, Cox EC. Golding I, et al. Curr Biol. 2006 May 23;16(10):R371-3. doi: 10.1016/j.cub.2006.04.014. Curr Biol. 2006. PMID: 16713947
Similar articles
- Eukaryotic transcription: what does it mean for a gene to be 'on'?
Golding I, Cox EC. Golding I, et al. Curr Biol. 2006 May 23;16(10):R371-3. doi: 10.1016/j.cub.2006.04.014. Curr Biol. 2006. PMID: 16713947 - Live imaging of nascent RNA dynamics reveals distinct types of transcriptional pulse regulation.
Muramoto T, Cannon D, Gierlinski M, Corrigan A, Barton GJ, Chubb JR. Muramoto T, et al. Proc Natl Acad Sci U S A. 2012 May 8;109(19):7350-5. doi: 10.1073/pnas.1117603109. Epub 2012 Apr 23. Proc Natl Acad Sci U S A. 2012. PMID: 22529358 Free PMC article. - Dictyostelium ribosomal protein genes and the elongation factor 1B gene show coordinate developmental regulation which is under post-transcriptional control.
Agarwal AK, Blumberg DD. Agarwal AK, et al. Differentiation. 1999 Jun;64(5):247-54. doi: 10.1046/j.1432-0436.1999.6450247.x. Differentiation. 1999. PMID: 10374261 - Synthesis and translation of messenger RNA during differentiation of the cellular slime mold Dictyostelium discoideum.
Lodish HF, Alton T, Dottin RP, Weiner AM, Margolskee JP. Lodish HF, et al. Symp Soc Dev Biol. 1976;(34):75-103. Symp Soc Dev Biol. 1976. PMID: 798345 Review. No abstract available. - Origins and consequences of transcriptional discontinuity.
Suter DM, Molina N, Naef F, Schibler U. Suter DM, et al. Curr Opin Cell Biol. 2011 Dec;23(6):657-62. doi: 10.1016/j.ceb.2011.09.004. Epub 2011 Sep 29. Curr Opin Cell Biol. 2011. PMID: 21963300 Review.
Cited by
- Regulation of spatiotemporal limits of developmental gene expression via enhancer grammar.
Keller SH, Jena SG, Yamazaki Y, Lim B. Keller SH, et al. Proc Natl Acad Sci U S A. 2020 Jun 30;117(26):15096-15103. doi: 10.1073/pnas.1917040117. Epub 2020 Jun 15. Proc Natl Acad Sci U S A. 2020. PMID: 32541043 Free PMC article. - Intercellular Variability in Protein Levels from Stochastic Expression and Noisy Cell Cycle Processes.
Soltani M, Vargas-Garcia CA, Antunes D, Singh A. Soltani M, et al. PLoS Comput Biol. 2016 Aug 18;12(8):e1004972. doi: 10.1371/journal.pcbi.1004972. eCollection 2016 Aug. PLoS Comput Biol. 2016. PMID: 27536771 Free PMC article. - Spectral analysis on time-course expression data: detecting periodic genes using a real-valued iterative adaptive approach.
Agyepong KS, Hsu FH, Dougherty ER, Serpedin E. Agyepong KS, et al. Adv Bioinformatics. 2013;2013:171530. doi: 10.1155/2013/171530. Epub 2013 Feb 28. Adv Bioinformatics. 2013. PMID: 23533399 Free PMC article. - Robustness of self-organizing chemoattractant field arising from precise pulse induction of its breakdown enzyme: a single-cell level analysis of PDE expression in Dictyostelium.
Masaki N, Fujimoto K, Honda-Kitahara M, Hada E, Sawai S. Masaki N, et al. Biophys J. 2013 Mar 5;104(5):1191-202. doi: 10.1016/j.bpj.2013.01.023. Biophys J. 2013. PMID: 23473502 Free PMC article. - From analog to digital models of gene regulation.
Munsky B, Neuert G. Munsky B, et al. Phys Biol. 2015 Jun 18;12(4):045004. doi: 10.1088/1478-3975/12/4/045004. Phys Biol. 2015. PMID: 26086470 Free PMC article. Review.
References
- Bertrand E, Chartrand P, Schaefer M, Shenoy SM, Singer RH, Long RM. Localization of ASH1 mRNA particles in living yeast. Mol Cell. 1998;2:437–445. - PubMed
- Elowitz MB, Levine AJ, Siggia ED, Swain PS. Stochastic gene expression in a single cell. Science. 2002;297:1183–1186. - PubMed
- Acar M, Becskei A, van Oudenaarden A. Enhancement of cellular memory by reducing stochastic transitions. Nature. 2005;435:228–232. - PubMed
Publication types
MeSH terms
Substances
LinkOut - more resources
Full Text Sources
Other Literature Sources


