Thymic output in aged mice - PubMed (original) (raw)
Thymic output in aged mice
J Scott Hale et al. Proc Natl Acad Sci U S A. 2006.
Abstract
Using GFP to mark recent thymic emigrants (RTEs) in mice carrying a GFP transgene driven by the recombination-activating gene 2 promoter, we demonstrate that RTEs are readily detectable even in 2-year-old mice, despite the fact that the proportion of the peripheral T cell pool comprised of RTEs declines with age. Although the number of RTEs decreases after reaching a peak at 6 weeks of age, thymic output as a function of thymic size is surprisingly age-independent. The CD4:CD8 ratio of RTEs declines with age, partly because of a striking decrease in steady-state proliferation of CD4+ RTEs in older mice. RTEs in aged mice undergo phenotypic maturation in the lymphoid periphery with delayed kinetics compared with young mice. RTEs from aged mice secrete less IL-2, proliferate less well, and achieve only weak expression of early-activation markers compared with more mature naïve peripheral T cells from the same mice. The proportion of GFP- cells in the CD4+ and CD8+ thymic compartments increases with age, partly as a result of leakiness in the aged thymus, allowing reentry of naïve peripheral T cells.
Conflict of interest statement
Conflict of interest statement: No conflicts declared.
Figures
Fig. 1.
RTEs remain readily detectable even in 2-year-old mice, and thymic output as a function of thymic size is relatively age-independent. Splenocytes and thymocytes from individual RAG2p-GFP Tg mice of the indicated ages were stained for CD4 and CD8 surface expression. (A) GFPhi and GFPlow gates were defined on SP thymocytes (Left) and applied to splenocytes (Right). (B) The number of total and DP thymocytes was determined as a function of age. (C) The percentages of GFPhi (filled squares) and GFPlow (open circles) cells among CD4+ and CD8+ splenocytes were determined in mice of the indicated ages. (D) By using organ cell counts and the percentage of DP thymocytes and RTEs (GFPhi plus GFPlow), the total number (Left) and the number per 100 DP thymocytes (Right) of splenic CD4+ (open squares) and CD8+ (filled circles) RTEs were calculated.
Fig. 2.
The CD4:CD8 ratio of RTEs decreases with age, whereas that of SP thymocytes increases. Splenocytes and thymocytes from individual RAG2p-GFP Tg mice of the indicated ages were stained for CD4 and CD8 surface expression. (A) The CD4:CD8 ratio of peripheral CD4+ and CD8+ T cells was determined among GFPhi (gray squares), GFPlow (open circles), and GFPneg (black triangles) T cells. (B) The CD4:CD8 ratio was calculated for GFPhi SP thymocytes (striped bars) and GFPhi splenocytes (gray bars). Bars represent the average CD4:CD8 ratios for 6–26 mice within the indicated age ranges, and error bars represent standard deviations of the means. Using a two-tailed Student t test with equal variance, P = 0.0028 (∗), 0.00052 (∗∗), and 0.00043 (∗∗∗) for the bracketed values.
Fig. 3.
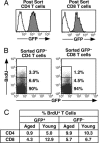
Age dampens the steady-state proliferation of CD4+ and, to a lesser extent, CD8+ RTEs. (A) Peripheral T cells from eight 6-week-old and eight 50- to 60-week-old mice fed BrdU in their drinking water for 8 days were stained for CD4 and CD8 and sorted into four populations: CD4+ GFP+ (Left, filled histograms), CD4+ GFP− (Left, open histograms), CD8+ GFP+ (Right, filled histograms), and CD8+ GFP− (Right, open histograms). (B) Sorted cells were stained with anti-BrdU and analyzed by using the illustrated gates into BrdUhi, BrdUlow, and BrdUneg populations. Percentages of cells falling into these populations are shown in representative dot plots for the sorted GFP− CD4+ (Left) and CD8+ (Right) populations. Cytoplasmic GFP is lost during the procedure. (C) Percentages of BrdU+ (BrdUhi plus BrdUlow) CD4+ and CD8+ populations that are GFP+ and GFP− are shown. Data are representative of three independent experiments.
Fig. 4.
Phenotypic maturation of RTEs occurs with delayed kinetics in aged compared with young mice. Splenocytes and thymocytes from mice of the indicated ages were stained for CD4, CD8, CD24, and Qa2 surface expression. GFP+ CD4+ and CD8+ SP thymocytes (black histograms) and splenocytes gated as GFPhi (green histograms), GFPlow (pink histograms), and GFPneg (blue histograms) were analyzed for CD24 and Qa2 expression. Data are representative of seven or more mice analyzed from each age group in five independent experiments.
Fig. 5.
Functional maturation occurs in CD4+ RTEs from aged mice. (A) CD4+ RTEs from aged mice secrete less IL-2 and proliferate less even in the presence of exogenous IL-2 than do CD4+ GFP− naïve T cells from the same animals. Sorted GFP+ (white bars) and naïve GFP− (gray bars) CD4+ peripheral T cells from eight 68- to 69-week-old mice and purified, unsorted total CD4+ T cells (striped bars) pooled from two 7-week-old mice were stimulated for 24 or 48 h with 30 ng/ml anti-CD3 plus 1 μg/ml anti-CD28 in the presence of APCs. (Left) The amount of IL-2 in the culture supernatants is shown as means ± SD. P = 0.00005 for the bracketed values using a two-tailed Student t test with equal variance. (Right) [3H]Thymidine incorporation during an 18-h pulse was measured after 48 h of stimulation in the presence of 25 units/ml exogenous IL-2. Mean values are shown for triplicate wells, and error bars represent standard deviation of the mean cpm. P = 0.0028 for the bracketed values using a two-tailed Student t test with equal variance. (B) Stimulated CD4+ GFP+ T cells from aged mice express lower levels of CD69 and CD25 than do their GFP− counterparts. The same populations as in A were stained after 48 h of stimulation for CD4 and CD69 or CD25. Histograms were gated on CD4+ T cells.
Fig. 6.
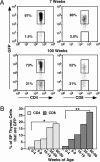
The proportion of GFP− thymocytes increases with age in both the CD4 and CD8 SP compartments. Thymocytes from 7-week-old and 100-week-old RAG2p-GFP Tg mice were stained for CD4 and CD8 surface expression. (A) Shown are the percentages of GFPhi and GFPneg cells gated as CD4 SP (Left) and CD8 SP (Right). (B) The mean percentages of GFP− CD4 SP (light gray bars) and CD8 SP (dark gray bars) thymocytes are shown for eight or more mice of the indicated age ranges. P = 7.2 × 10⁻⁶ (∗) and 1.8 × 10⁻¹² (∗∗) for bracketed values using a two-tailed Student t test with equal variance.
Similar articles
- Role of ovarian hormones in age-associated thymic involution revisited.
Perisić M, Arsenović-Ranin N, Pilipović I, Kosec D, Pesić V, Radojević K, Leposavić G. Perisić M, et al. Immunobiology. 2010 Apr;215(4):275-93. doi: 10.1016/j.imbio.2009.06.012. Epub 2009 Jul 4. Immunobiology. 2010. PMID: 19577818 - Thymic output: Assessment of CD4+ recent thymic emigrants and T-Cell receptor excision circles in infants.
Ravkov E, Slev P, Heikal N. Ravkov E, et al. Cytometry B Clin Cytom. 2017 Jul;92(4):249-257. doi: 10.1002/cyto.b.21341. Epub 2016 Jan 28. Cytometry B Clin Cytom. 2017. PMID: 26566232 - Homeostatic properties and phenotypic maturation of murine CD4+ pre-thymic emigrants in the thymus.
Dong J, Chen Y, Xu X, Jin R, Teng F, Yan F, Tang H, Li P, Sun X, Li Y, Wu H, Zhang Y, Ge Q. Dong J, et al. PLoS One. 2013;8(2):e56378. doi: 10.1371/journal.pone.0056378. Epub 2013 Feb 11. PLoS One. 2013. PMID: 23409179 Free PMC article. - Protein tyrosine kinase 7: a novel surface marker for human recent thymic emigrants with potential clinical utility.
Lewis DB, Haines C, Ross D. Lewis DB, et al. J Perinatol. 2011 Apr;31 Suppl 1:S72-81. doi: 10.1038/jp.2010.187. J Perinatol. 2011. PMID: 21448210 Review. - Measuring emigration of human thymocytes by T-cell receptor excision circles.
Ye P, Kirschner DE. Ye P, et al. Crit Rev Immunol. 2002;22(5-6):483-97. Crit Rev Immunol. 2002. PMID: 12803323 Review.
Cited by
- Comprehensive Flow Cytometric, Immunohistologic, and Molecular Assessment of Thymus Function in Rhesus Macaques.
Hale LP, Macintyre AN, Bowles DE, Kwun J, Li J, Theriot B, Turek JW. Hale LP, et al. Immunohorizons. 2024 Jul 1;8(7):500-510. doi: 10.4049/immunohorizons.2300112. Immunohorizons. 2024. PMID: 39018546 Free PMC article. - Mechanisms underlying the direct programming of mouse embryonic fibroblasts to thymic epithelial cells by FOXN1.
Ma Z, Woo Kang S, Condie BG, Manley NR. Ma Z, et al. Development. 2024 Jul 15;151(14):dev202730. doi: 10.1242/dev.202730. Epub 2024 Jul 22. Development. 2024. PMID: 38958026 - Effects of Deuterium Depletion on Age-Declining Thymopoiesis In Vivo.
Yaglova NV, Obernikhin SS, Timokhina EP, Tsomartova DA, Yaglov VV, Nazimova SV, Tsomartova ES, Ivanova MY, Chereshneva EV, Lomanovskaya TA. Yaglova NV, et al. Biomedicines. 2024 Apr 25;12(5):956. doi: 10.3390/biomedicines12050956. Biomedicines. 2024. PMID: 38790918 Free PMC article. - Evolution of T cells in the cancer-resistant naked mole-rat.
Lin TD, Rubinstein ND, Fong NL, Smith M, Craft W, Martin-McNulty B, Perry R, Delaney MA, Roy MA, Buffenstein R. Lin TD, et al. Nat Commun. 2024 Apr 11;15(1):3145. doi: 10.1038/s41467-024-47264-x. Nat Commun. 2024. PMID: 38605005 Free PMC article. - Selective ablation of thymic and peripheral Foxp3+ regulatory T cell development.
Yilmazer A, Zevla DM, Malmkvist R, Rodríguez CAB, Undurraga P, Kirgin E, Boernert M, Voehringer D, Kershaw O, Schlenner S, Kretschmer K. Yilmazer A, et al. Front Immunol. 2023 Dec 18;14:1298938. doi: 10.3389/fimmu.2023.1298938. eCollection 2023. Front Immunol. 2023. PMID: 38164128 Free PMC article.
References
- Linton P. J., Dorshkind K. Nat. Immunol. 2004;5:133–139. - PubMed
- Scollay R. J. Immunol. 1982;128:1566–1570. - PubMed
- Scollay R., Chen W. F., Shortman K. J. Immunol. 1984;132:25–30. - PubMed
Publication types
MeSH terms
Grants and funding
- R01 AI064318/AI/NIAID NIH HHS/United States
- R21 AG023781/AG/NIA NIH HHS/United States
- R01 AI 064318/AI/NIAID NIH HHS/United States
- R21 AG 023781/AG/NIA NIH HHS/United States
LinkOut - more resources
Full Text Sources
Other Literature Sources
Medical
Research Materials
Miscellaneous


