Calcium-independent phospholipase A2 localizes in and protects mitochondria during apoptotic induction by staurosporine - PubMed (original) (raw)
Calcium-independent phospholipase A2 localizes in and protects mitochondria during apoptotic induction by staurosporine
Konstantin Seleznev et al. J Biol Chem. 2006.
Abstract
Mitochondria-mediated production of reactive oxygen species (ROS) plays a key role in apoptosis. Mitochondrial phospholipid cardiolipin molecules are likely the main target of ROS because they are particularly rich in polyunsaturated fatty acids. They are also located in the inner mitochondrial membrane near the ROS-producing sites. Under physiological conditions mitochondria can repair peroxidative damage in part through a remodeling mechanism via the deacylation-reacylation cycle mediated by phospholipase A2 (PLA2) and acyl-coenzyme A-dependent monolysocardiolipin acyltransferase. Here we investigate whether group VIA Ca2+-independent PLA2 (iPLA2) plays a role in the protection of mitochondrial function from damage caused by mitochondrially generated ROS during apoptotic induction by staurosporine (STS). We show that iPLA2-expressing cells were relatively resistant to STS-induced apoptosis. iPLA2 localized to mitochondria even before apoptotic induction, and most iPLA2-associated mitochondria were intact in apoptotic resistant cells. Expression of iPLA2 in INS-1 cells prevented the loss of mitochondrial membrane potential, attenuated the release of cytochrome c, Smac/DIABLO, and apoptosis inducing factor from mitochondria, and reduced mitochondrial reactive oxygen species production. Inhibition of caspase 8 has little effect on STS-induced apoptosis in INS-1 cells. Finally, we found that STS down-regulated endogenous iPLA2 transcription in both INS-1 and iPLA2-expressing INS-1 cells without affecting the expression of group IV Ca2+-dependent PLA2. Together, our data indicate that iPLA2 is important for the protection of mitochondrial function from oxidative damage during apoptotic induction. Down-regulation of endogenous iPLA2 by STS may result in the loss of mitochondrial membrane repair functions and lead to mitochondrial failure and apoptosis.
Figures
FIGURE 1
STS induces apoptosis, mitochondrial ROS generation, and membrane lipid peroxidation in INS-1 cells. A, FACS analysis of apoptosis as indicated by PS externalization. INS-1 cells were treated with or without 1 μM STS for 8 h. Cells were collected and stained with an annexin V (AnnV )-FLUOS labeling solution containing annexin V and PI, analyzed by FACS (left panel ), and results are summarized (right panel). R1 represents annexin V-positive and PI-negative cells, and R2 represents annexin V- and PI-positive cells. B, mitochondrial ROS production. Cells were collected and stained with 2 μM HE and analyzed on a BD Biosciences FACSCalibur. Representative histograms obtained are presented. The left histogram shows autofluorescence, and the right histogram shows cells containing converted HE. C, membrane lipid peroxidation. Cells were collected and treated with trichloroacetic acid/TBARS reagent. Each sample was incubated at 95 °C for 60 min. The supernatants were analyzed, and values are expressed as a percentage of control values. Data are the averages ± S.D. (n = 4). *, p < 0.05.
FIGURE 2
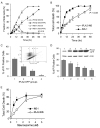
Comparison of STS-induced apoptosis in INS-1 and iPLA2-INS cells. A, time course of STS-induced early (annexin V-positive and PI-negative) and late (annexin V- and PI-positive) apoptosis in INS-1 (triangles) and iPLA2-INS cells (squares). B, total cell death (all annexin V-positive cells). INS-1 and iPLA2-INS cells were treated with 1 μM STS for increasing amounts of time. Cells were collected and stained with an annexin V-FLUOS labeling solution and analyzed by FACS. Data are the averages ± S.D. (n = 6). #, p > 0.05. All others were statistically significant. C, FACS analysis of cell death among cells with varying levels of iPLA2-GFP fusion protein. INS-1 cells were transiently transfected with iPLA2-GFP construct. After 48 h, the cells were treated with STS for 8 h, stained with PI alone, and subjected to FACS analysis (inset). Group 1 corresponds to non-transfected cells; group 2 are cells exhibiting a 1-2-fold increase in iPLA2-GFP; group 3 are cells exhibiting a 3-4-fold increase of iPLA2-GFP; group 4 are cells with a greater than 4-fold increase. Cells under the line are living, and those above are dead. The percentage of PI-positive cells in each group is displayed. Data are the averages ± S.D. (n = 4). *, compared with group 1, p < 0.05. D, STS-induced apoptosis in cell lines stably expressing iPLA2-GFP. INS-1 cells were transfected with iPLA2-GFP construct and selected with G418 after 48 h. Individual G418-resistant colonies were picked, and iPLA2-GFP expression was analyzed with anti-GFP antibodies (inner panel). Five cell lines with increasing levels of iPLA2-GFP expression were treated with STS for 8 h, stained with PI alone, and analyzed by FACS. Data are the averages ± S.D. (n = 3). *, compared with cell line 1, p < 0.05. E, Comparison of STS concentration-dependent apoptosis between INS-1 and iPLA2-INS cells. Data are the averages ± S.D. (n = 4). p < 0.05.
FIGURE 3
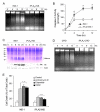
iPLA2 prevents apoptosis induced by mitochondrially generated superoxide. A, apoptotic DNA ladder analysis of INS-1 cells. After 1 μM STS treatment as in Fig. 1_A_, DNA was purified by an Apoptotic DNA ladder kit and analyzed on an agarose gel. B, comparison of caspase 3 activity between INS-1 and iPLA2-INS cells during STS-induced apoptosis. Caspase 3 activity was determined by a CaspACE assay system (n = 6). *, p < 0.05. C, accumulation of histones in the cytoplasm of the cells. After treatment with 1 μM STS for the indicated times, cytosol from both cell lines was prepared and analyzed by SDS-PAGE (upper) and Western blot for histone 4 (lower). D, apoptotic DNA ladder analysis in CHO cells. Mock-transfected CHO cells and CHO cells transfected with pcDNA3-iPLA2 were treated with 1 μM STS for the indicated times. The cells were collected, and DNA was prepared as in A and analyzed on an agarose gel. E, comparison of actinomycin D-, etoposide-, and H2O2-induced apoptosis between INS-1 and iPLA2-INS cells. Cells were treated with actinomycin D etoposide for 8 h and with H2O2 for 4 h. *, compared with control; **, compared between INS-1 and iPLA2-INS cells. p < 0.05.
FIGURE 4
iPLA2 localizes to mitochondria. A, colocalization of iPLA2-GFP with mitochondria. pEGFP-iPLA2-transfected INS-1 cells were incubated for 15 min in Mito Tracker Red CMXRos, fixed with 3.8% paraformaldehyde, stained with 4′,6-diamidino-2-phenylindole, and analyzed on a Zeiss LSM 510 META confocal laser scanning microscope. Images of red (Mito Tracker) and green (iPLA2-GFP) fluorescence were collected by confocal microscopy. Colocalization of iPLA2-GFP with mitochondria appears as yellow to orange spots, depending on the ratio of the merged red and green fluorescence. B, resistance of cells expressing GFP-iPLA2 to STS-induced apoptosis. pEGFP-iPLA2-transfected INS-1 cells were treated with STS and incubated with Mito Tracker Red CMXrox as in A. The cells with green and yellow to orange dots are iPLA2-GFP-transfected INS-1 cells. Those with red color only are non-transfected cells. C, localization of iPLA2-GFP in mitochondria during STS-induced apoptosis in individual cells. Merged images of red (mitochondria) and green (iPLA2-GFP) fluorescence were collected by confocal microscopy. The images represent at least four independent experiments with similar results.
FIGURE 5
iPLA2 prevents the loss of mitochondrial membrane potential (ΔΨ). A, FACS analysis of the loss of mitochondrial membrane potential (ΔΨ). INS-1 and iPLA2-INS cells were treated with 1 μM STS for 12 h and labeled with JC-1 reagent for 15 min. After washing, JC-1-labeled cells were sorted by FACS. Cells under the horizontal line are the cells that lost the red color. B, time course of STS-induced the loss of mitochondrial membrane potential. INS-1 and iPLA2-INS cells were treated with 1 μM STS for increasing times and analyzed as in A. Values are expressed as a percentage of green versus total cells. Data are the averages ± S.D. (n = 6). *, p < 0.05. C, iPLA2 prevents the loss of mitochondrial membrane potential (ΔΨ) in CHO cells. CHO and iPLA2-CHO cells were treated with STS for 8 h. Data are the averages ± S.D. (n = 4). *, p < 0.05. D, iPLA2 prevents the loss of mitochondrial membrane potential (ΔΨ) after H2O2 treatment. INS-1 and iPLA2-INS cells were treated for 4 h with increasing concentrations of H2O2. Cells were then washed in PBS and labeled with JC-1. After washing, the cells were analyzed by flow cytometry. Data are the averages ± S.D. (n = 4). *, p < 0.05.
FIGURE 6
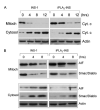
iPLA2 attenuates the release of cytochrome c , Smac/DIABLO, and AIF from mitochondria. A, effect of iPLA2 on cytochrome c in INS-1 cells. INS-1 and iPLA2-INS cells were treated with 1 μM STS for increasing times, and cytoplasmic (Cyt.) and mitochondrial (Mitoch) fractions were prepared with a mitochondria/cytosol fractionation kit. The samples from each fraction were analyzed by Western blot for cytochrome c. B, effect of iPLA2 on Smac/DIABLO and AIF in INS-1 cells. Samples were prepared analyzed as in A for Smac/DIABLO and AIF in both fractions.
FIGURE 7
iPLA2 reduces STS-induced ROS production. INS-1 and iPLA2-INS cells were treated with 1 μM STS, collected, stained with 2 μM HE, and analyzed by FACS. Values are expressed as a percentage of total cell counts. Data are the averages ± S.D. (n = 4). *, p < 0.05.
FIGURE 8
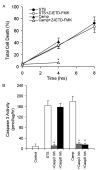
Caspase 8 is not required for STS-induced apoptosis in INS-1 cells. A, INS-1 cells were pretreated with or without 20 μM Z-IETD-FMK, a caspase 8-specific inhibitor, for 30 min before being treated with 1 μM STS or 5 μM camptothecin (Camp) for the indicated amounts of time. Cells were collected, stained with an annexin V-FLUOS labeling solution containing annexin V and PI, and analyzed by FACS. Values are expressed as a percentage of annexin V-positive versus total cells. Data are the averages ± S.D. (n = 4). *, p < 0.05. B, caspase 3 activation analysis. INS-1 cells were pretreated with caspase 3-specific inhibitor (Z-DEVD-FMK) and caspase 8-specific inhibitor (Z-IETD-FMK) and followed by STS or camptothecin treatment for 6 h. Caspase 3 activity was determined by a CaspACE assay system (n = 4). *, p < 0.05.
FIGURE 9
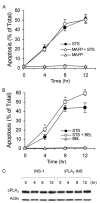
cPLA2 does not participate in STS-induced apoptosis. A, annexin V-FLUOS analysis of STS-induced apoptosis of INS-1 cells in the presence of a cPLA2 inhibitor. INS-1 cells were pretreated with 10 μM MAPF before treatment with 1 μM STS. Cells were collected, labeled with an annexin V-FLUOS labeling solution, and analyzed by flow cytometry. The data represent cells stained only by annexin V-FLUOS. Data are the averages ± S.D. (n = 6). MAFP, methyl arachidonyl fluorophosphonate. B, annexin V-FLUOS analysis of STS-induced apoptosis of INS-1 cell in the presence of the iPLA2 inhibitor BEL. INS-1 cells were pretreated with 10 μM BEL before treatment with 1 μM STS. Data are the averages ± S.D. (n = 6). *, p < 0.05. C, Western blot analysis of cPLA2 expression in INS-1 and iPLA2-INS cells during STS-induced apoptosis. Both INS-1 and iPLA2-INS cells were treated with 1 μM STS and collected at the indicated times. Cell lysates were prepared and analyzed by Western blot for cPLA2 and actin.
FIGURE 10
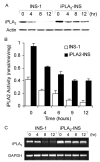
iPLA2 transcription is down-regulated in STS-induced apoptosis. A, Western blot analysis of iPLA2 expression during STS-induced apoptosis. INS-1 and iPLA2-INS cells were treated with 1 μM STS and harvested at the times indicated. Cell lysates were prepared and analyzed by Western blot for iPLA2 and actin. B, iPLA2 activity analysis. INS-1 and iPLA2-INS cells were treated with 1 μM STS and harvested at the times indicated. Cell lysates were prepared and analyzed for iPLA2 activity. Data are the averages ± S.D. (n = 4). p < 0.05, compared with 0 h and between INS-1 and iPLA2-INS cells. C, RT-PCR analysis of iPLA2 cDNA during STS induction. INS-1 and iPLA2-INS cells were treated with 1 μM STS and harvested at the times indicated. Total RNA was isolated from each sample, and aliquots were subjected to RT-PCR analysis for iPLA2 and glyceraldehyde-3-phosphate dehydrogenase (GAPDH), respectively.
Similar articles
- Exendin-4 protects mitochondria from reactive oxygen species induced apoptosis in pancreatic Beta cells.
Li Z, Zhou Z, Huang G, Hu F, Xiang Y, He L. Li Z, et al. PLoS One. 2013 Oct 24;8(10):e76172. doi: 10.1371/journal.pone.0076172. eCollection 2013. PLoS One. 2013. PMID: 24204601 Free PMC article. - Cellular function of calcium-independent phospholipase A2.
Akiba S, Sato T. Akiba S, et al. Biol Pharm Bull. 2004 Aug;27(8):1174-8. doi: 10.1248/bpb.27.1174. Biol Pharm Bull. 2004. PMID: 15305016 Review. - Cellular regulation and proposed biological functions of group VIA calcium-independent phospholipase A2 in activated cells.
Balsinde J, Balboa MA. Balsinde J, et al. Cell Signal. 2005 Sep;17(9):1052-62. doi: 10.1016/j.cellsig.2005.03.002. Epub 2005 Apr 7. Cell Signal. 2005. PMID: 15993747 Review.
Cited by
- Suppression of mitochondrial function by oxidatively truncated phospholipids is reversible, aided by bid, and suppressed by Bcl-XL.
Chen R, Feldstein AE, McIntyre TM. Chen R, et al. J Biol Chem. 2009 Sep 25;284(39):26297-308. doi: 10.1074/jbc.M109.018978. Epub 2009 Aug 4. J Biol Chem. 2009. PMID: 19654426 Free PMC article. - Phospholipase A2 biochemistry.
Burke JE, Dennis EA. Burke JE, et al. Cardiovasc Drugs Ther. 2009 Feb;23(1):49-59. doi: 10.1007/s10557-008-6132-9. Epub 2008 Oct 18. Cardiovasc Drugs Ther. 2009. PMID: 18931897 Free PMC article. Review. - Advanced glycation end products inhibit glucose-stimulated insulin secretion through nitric oxide-dependent inhibition of cytochrome c oxidase and adenosine triphosphate synthesis.
Zhao Z, Zhao C, Zhang XH, Zheng F, Cai W, Vlassara H, Ma ZA. Zhao Z, et al. Endocrinology. 2009 Jun;150(6):2569-76. doi: 10.1210/en.2008-1342. Epub 2009 Feb 26. Endocrinology. 2009. PMID: 19246537 Free PMC article. - Mitochondrial dysfunction and defects in lipid homeostasis as therapeutic targets in neurodegeneration with brain iron accumulation.
Kinghorn KJ, Castillo-Quan JI. Kinghorn KJ, et al. Rare Dis. 2016 Jan 25;4(1):e1128616. doi: 10.1080/21675511.2015.1128616. eCollection 2016. Rare Dis. 2016. PMID: 27141409 Free PMC article. - The cationic cluster of group IVA phospholipase A2 (Lys488/Lys541/Lys543/Lys544) is involved in translocation of the enzyme to phagosomes in human macrophages.
Casas J, Valdearcos M, Pindado J, Balsinde J, Balboa MA. Casas J, et al. J Lipid Res. 2010 Feb;51(2):388-99. doi: 10.1194/jlr.M001461. Epub 2009 Aug 28. J Lipid Res. 2010. PMID: 19717620 Free PMC article.
References
- Orrenius S. Toxicol. Lett. 2004;149:19–23. - PubMed
- Green DR, Kroemer G. Science. 2004;305:626–629. - PubMed
- Acehan D, Jiang X, Morgan DG, Heuser JE, Wang X, Akey CW. Mol. Cell. 2002;9:423–432. - PubMed
- Budihardjo I, Oliver H, Lutter M, Luo X, Wang X. Annu. Rev. Cell Dev. Biol. 1999;15:269–290. - PubMed
- Cadenas E. Mol. Aspects Med. 2004;25:17–26. - PubMed
Publication types
MeSH terms
Substances
LinkOut - more resources
Full Text Sources
Miscellaneous

