Extension of a genetic network model by iterative experimentation and mathematical analysis - PubMed (original) (raw)
Extension of a genetic network model by iterative experimentation and mathematical analysis
James C W Locke et al. Mol Syst Biol. 2005.
Abstract
Circadian clocks involve feedback loops that generate rhythmic expression of key genes. Molecular genetic studies in the higher plant Arabidopsis thaliana have revealed a complex clock network. The first part of the network to be identified, a transcriptional feedback loop comprising TIMING OF CAB EXPRESSION 1 (TOC1), LATE ELONGATED HYPOCOTYL (LHY) and CIRCADIAN CLOCK ASSOCIATED 1 (CCA1), fails to account for significant experimental data. We develop an extended model that is based upon a wider range of data and accurately predicts additional experimental results. The model comprises interlocking feedback loops comparable to those identified experimentally in other circadian systems. We propose that each loop receives input signals from light, and that each loop includes a hypothetical component that had not been explicitly identified. Analysis of the model predicted the properties of these components, including an acute light induction at dawn that is rapidly repressed by LHY and CCA1. We found this unexpected regulation in RNA levels of the evening-expressed gene GIGANTEA (GI), supporting our proposed network and making GI a strong candidate for this component.
Figures
Figure 1
The single-loop LHY/CCA1–TOC1-X network. Left panel: Network diagram. LHY and CCA1 are modelled as a single gene, LHY (genes are boxed). Nuclear and cytoplasmic protein levels are grouped for clarity (shown encircled) and degradation is not shown. Light acutely activates LHY transcription at dawn and activates TOC1 transcription throughout the day. TOC1 activates a putative gene X, which in turn activates LHY. Nuclear LHY protein represses TOC1 transcription. Right panel: Simulation of mRNA levels for the optimal parameter set. In all figures, filled box above the panel represent dark interval and open or no box represent light interval. LHY mRNA (dotted line) peaks at dawn in LD12:12 and TOC1 (solid line) falls after dusk, due to the loss of light activation.
Figure 2
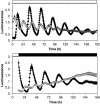
Expression of _CCR2:LUC_+ in WT (filled diamonds) and cca1-11;lhy-21 double mutant (open diamonds) plants in LL (top) and DD (bottom). Luminescence of each seedling was normalised to its mean value over the entire time course. Data are averages of normalised luminescence from WT seedlings in LL _n_=16, in DD _n_=18, cca1;lhy seedlings in LL _n_=13, in DD _n_=15. Error bars represent one s.e.m., often within symbols.
Figure 3
PTC for WT (left panel) and cca1;lhy double mutant (right panel). Red light pulses (15 μmol m−2 s−1 for 1 h) were administered at 3 h intervals to _CCR2:LUC_+ plants in DD. The new phase of the rhythm induced by the light pulses was converted to circadian time (CT, 24ths of the free-running period) and plotted against the circadian time of light treatment (solid lines). Simulated phase responses are represented by dashed lines, and show simulated response of the interlocked feedback loop model to a 1 h light pulse. Phase marker for simulation was TOC1 mRNA peak, compared to _CCR2:LUC_+ peak in data.
Figure 4
The interlocked feedback loop network. Left panel: Network diagram. Compared to Figure 1, TOC1 is activated by light indirectly via hypothetical gene Y. Y activates TOC1 transcription and both LHY and TOC1 repress Y transcription, forming a second feedback loop. Right panel: Simulation of LHY (dashed line) and TOC1 (solid line) mRNA levels for the optimal parameter set, representing WT (top) and cca1;lhy double mutant (bottom) in DD. Translation rate of LHY mRNA in simulated mutant is 1/1000 WT value. Period of WT in DD is 26 h and period of mutant is 17 h.
Figure 5
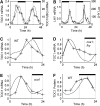
Comparison of interlocked feedback loop simulations (dashed line) under LD to data (solid line). (A) TOC1 mRNA levels in WT plants entrained to LD12:12, left axis; TOC1 mRNA levels relative to UBIQUITIN (UBQ) (Makino et al, 2000), right axis. (B) LHY mRNA levels in WT plants entrained to LD12:12, left axis; data from Kim et al (2003), right axis. (C–E) TOC1 mRNA levels in WT (C), cca1;lhy mutant (D) and cca1 mutant (E) entrained to LD16:8; data from Mizoguchi et al (2002). Translation rate of LHY in simulated cca1 is set to 1/2 WT value. Highest value of data and simulation is set to 1, for each panel. (F) TOC1 protein levels for WT simulation entrained to LD12:12; TOC1 fusion protein data from Mas et al (2003b).
Figure 6
GI is a candidate gene for Y. Simulated Y mRNA levels under LD12:12 and LL (dashed line). Data for GI mRNA levels (crosses), assayed by quantitative RT–PCR relative to the ACT2 control, from samples harvested at the times indicated. Left panel, WT; right panel, cca1;lhy. Highest value of data and simulation is set to 1, for each panel.
Comment in
- A new model for circadian clock research?
Forger D, Drapeau M, Collins B, Blau J. Forger D, et al. Mol Syst Biol. 2005;1:2005.0014. doi: 10.1038/msb4100019. Epub 2005 Jun 28. Mol Syst Biol. 2005. PMID: 16729049 Free PMC article. No abstract available. - Systems biology flowering in the plant clock field.
Ueda HR. Ueda HR. Mol Syst Biol. 2006;2:60. doi: 10.1038/msb4100105. Epub 2006 Nov 14. Mol Syst Biol. 2006. PMID: 17102805 Free PMC article. No abstract available.
Similar articles
- ELF4 is a phytochrome-regulated component of a negative-feedback loop involving the central oscillator components CCA1 and LHY.
Kikis EA, Khanna R, Quail PH. Kikis EA, et al. Plant J. 2005 Oct;44(2):300-13. doi: 10.1111/j.1365-313X.2005.02531.x. Plant J. 2005. PMID: 16212608 - The molecular basis of temperature compensation in the Arabidopsis circadian clock.
Gould PD, Locke JC, Larue C, Southern MM, Davis SJ, Hanano S, Moyle R, Milich R, Putterill J, Millar AJ, Hall A. Gould PD, et al. Plant Cell. 2006 May;18(5):1177-87. doi: 10.1105/tpc.105.039990. Epub 2006 Apr 14. Plant Cell. 2006. PMID: 16617099 Free PMC article. - Circadian clock proteins LHY and CCA1 regulate SVP protein accumulation to control flowering in Arabidopsis.
Fujiwara S, Oda A, Yoshida R, Niinuma K, Miyata K, Tomozoe Y, Tajima T, Nakagawa M, Hayashi K, Coupland G, Mizoguchi T. Fujiwara S, et al. Plant Cell. 2008 Nov;20(11):2960-71. doi: 10.1105/tpc.108.061531. Epub 2008 Nov 14. Plant Cell. 2008. PMID: 19011118 Free PMC article. - The circadian system of Arabidopsis thaliana: forward and reverse genetic approaches.
Staiger D, Heintzen C. Staiger D, et al. Chronobiol Int. 1999 Jan;16(1):1-16. doi: 10.3109/07420529908998708. Chronobiol Int. 1999. PMID: 10023572 Review. - MYB transcription factors in the Arabidopsis circadian clock.
Carré IA, Kim JY. Carré IA, et al. J Exp Bot. 2002 Jul;53(374):1551-7. doi: 10.1093/jxb/erf027. J Exp Bot. 2002. PMID: 12096093 Review.
Cited by
- A circadian clock-regulated toggle switch explains AtGRP7 and AtGRP8 oscillations in Arabidopsis thaliana.
Schmal C, Reimann P, Staiger D. Schmal C, et al. PLoS Comput Biol. 2013;9(3):e1002986. doi: 10.1371/journal.pcbi.1002986. Epub 2013 Mar 28. PLoS Comput Biol. 2013. PMID: 23555221 Free PMC article. - Novel roles for GIGANTEA revealed under environmental conditions that modify its expression in Arabidopsis and Medicago truncatula.
Paltiel J, Amin R, Gover A, Ori N, Samach A. Paltiel J, et al. Planta. 2006 Nov;224(6):1255-68. doi: 10.1007/s00425-006-0305-1. Epub 2006 Jun 15. Planta. 2006. PMID: 16775702 - Functional analysis of amino-terminal domains of the photoreceptor phytochrome B.
Palágyi A, Terecskei K, Adám E, Kevei E, Kircher S, Mérai Z, Schäfer E, Nagy F, Kozma-Bognár L. Palágyi A, et al. Plant Physiol. 2010 Aug;153(4):1834-45. doi: 10.1104/pp.110.153031. Epub 2010 Jun 7. Plant Physiol. 2010. PMID: 20530216 Free PMC article. - Analysis of a post-translational steroid induction system for GIGANTEA in Arabidopsis.
Günl M, Liew EF, David K, Putterill J. Günl M, et al. BMC Plant Biol. 2009 Nov 30;9:141. doi: 10.1186/1471-2229-9-141. BMC Plant Biol. 2009. PMID: 19943973 Free PMC article. - Oscillator model reduction preserving the phase response: application to the circadian clock.
Taylor SR, Doyle FJ 3rd, Petzold LR. Taylor SR, et al. Biophys J. 2008 Aug;95(4):1658-73. doi: 10.1529/biophysj.107.128678. Epub 2008 May 16. Biophys J. 2008. PMID: 18487303 Free PMC article.
References
- Alabadi D, Oyama T, Yanovsky MJ, Harmon FG, Mas P, Kay SA (2001) Reciprocal regulation between TOC1 and LHY/CCA1 within the Arabidopsis circadian clock. Science 293: 880–883 - PubMed
- Alabadi D, Yanovsky MJ, Mas P, Harmer SL, Kay SA (2002) Critical role for CCA1 and LHY in maintaining circadian rhythmicity in Arabidopsis . Curr Biol 12: 757–761 - PubMed
- Brown KS, Sethna JP (2003) Statistical mechanical approaches to models with many poorly known parameters. Phys Rev E Stat Nonlinear Soft Matter Phys 68: 021904 - PubMed
- Brown PE (2004a) Biological Rhythms Analysis Software System http://www.amillar.org/Downloads.html
- Brown PE (2004b) Circadian Modelling http://www.amillar.org/Downloads.html
Publication types
MeSH terms
Substances
LinkOut - more resources
Full Text Sources
Other Literature Sources
Molecular Biology Databases
Research Materials


