Central projections of melanopsin-expressing retinal ganglion cells in the mouse - PubMed (original) (raw)
Comparative Study
. 2006 Jul 20;497(3):326-49.
doi: 10.1002/cne.20970.
Affiliations
- PMID: 16736474
- PMCID: PMC2885916
- DOI: 10.1002/cne.20970
Comparative Study
Central projections of melanopsin-expressing retinal ganglion cells in the mouse
Samer Hattar et al. J Comp Neurol. 2006.
Abstract
A rare type of ganglion cell in mammalian retina is directly photosensitive. These novel retinal photoreceptors express the photopigment melanopsin. They send axons directly to the suprachiasmatic nucleus (SCN), intergeniculate leaflet (IGL), and olivary pretectal nucleus (OPN), thereby contributing to photic synchronization of circadian rhythms and the pupillary light reflex. Here, we sought to characterize more fully the projections of these cells to the brain. By targeting tau-lacZ to the melanopsin gene locus in mice, ganglion cells that would normally express melanopsin were induced to express, instead, the marker enzyme beta-galactosidase. Their axons were visualized by X-gal histochemistry or anti-beta-galactosidase immunofluorescence. Established targets were confirmed, including the SCN, IGL, OPN, ventral division of the lateral geniculate nucleus (LGv), and preoptic area, but the overall projections were more widespread than previously recognized. Targets included the lateral nucleus, peri-supraoptic nucleus, and subparaventricular zone of the hypothalamus, medial amygdala, margin of the lateral habenula, posterior limitans nucleus, superior colliculus, and periaqueductal gray. There were also weak projections to the margins of the dorsal lateral geniculate nucleus. Co-staining with the cholera toxin B subunit to label all retinal afferents showed that melanopsin ganglion cells provide most of the retinal input to the SCN, IGL, and lateral habenula and much of that to the OPN, but that other ganglion cells do contribute at least some retinal input to these targets. Staining patterns after monocular enucleation revealed that the projections of these cells are overwhelmingly crossed except for the projection to the SCN, which is bilaterally symmetrical.
(c) 2006 Wiley-Liss, Inc.
Figures
Fig. 1
X-gal labeling of melanopsin ganglion cells in a retinal wholemount. Composite image derived from a stack of brightfield photomicrographs locally masked to reveal all labeled processes in sharp focus. Arrowheads mark axons in the optic fiber layer. Inset: Schematic charting of distribution of X-gal-labeled cell bodies in one retinal wholemount. Scale bar = 50 μm.
Fig. 2
Distribution of axons of mRGCs in optic nerve and tract. A: Confocal image of axonal anti-β-galactosidase immunoreactivity in a transverse section of the optic nerve. B,C: X-gal staining of axons in the optic tract contralateral (B) and ipsilateral (C) to a monocular enucleation. Axonal degeneration is almost complete in B but nearly absent in C, indicating that, beyond the SCN, melanopsin RGCs have predominantly crossed projections. Scale bar = 100 μm in A; 200 μm in C (applies to B,C).
Fig. 3
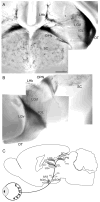
Overview of axonal projections of mRGCs. A,B: Whole brains stained by X-gal. A: Dorsal view, with rostral at the top. B: Lateral view with rostral at the left and dorsal at the top. C: Schematic drawing illustrating nuclear targets of melanopsin RGCs. Principle targets are shown in dark gray and secondary targets in light gray. Minor targets are indicated by small lettering and dots. For abbreviations, see list. Scale bar = 500 μm in A (applies to A,B).
Fig. 4
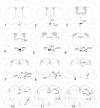
1–22: Chartings of schematic coronal sections, modified from the atlas of Paxinos and Franklin (2001), summarizing the distribution of X-gal-labeled fibers as seen in cases of monocular enucleation. The right side of the brain, shown on the right of each charting, is contralateral to the intact eye. For abbreviations, see list.
Fig. 5
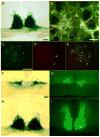
Axonal terminations of melanopsin ganglion cells in the suprachiasmatic nucleus of the hypothalamus. A: X-gal staining of melanopsin afferents to the SCN after right monocular enucleation. Although most labeled fibers in the contralateral (left) optic tract have degenerated, leaving only weak, granular labeling, labeling of the SCN is bilaterally symmetric. B: Confocal image of SCN showing double immunostaining for all contralateral retinal inputs (red; anti-cholera toxin B [CTB] immunofluorescence) and for all bilateral melanopsin RGC inputs (green; anti-β-galactosidase immunofluorescence). Most red, CTB-labeled afferents exhibit green anti-β-galactosidase labeling also, giving them a yellow appearance in the image, but a few contain little if any green labeling and presumably arise from non-melanopsin RGCs. Green axons lacking red immunofluorescence are presumably melanopsin afferents from the ipsilateral eye, which was not injected with CTB. Large circular dark profiles are unlabeled somata of SCN neurons. Projected stack of seven 1-μm confocal optical sections. C–E: Confocal image (optic section thickness 1 μm) grazing the caudal margin of the SCN from the same brain as in B and labeled by the same double-immunofluorescence method. Reduced afferent density permits individual axons to be resolved. Filled arrows indicate crossed retinal afferents (red) that are β-galactosidase negative (no green). Open arrows denote presumptive ipsilateral afferents from melanopsin RGCs (green, no red). F–I: Comparison of the distribution within the SCN and vSPZ of axons of melanopsin ganglion cells (X-gal staining in F and H) with those of VIP-immunoreactive processes in serially adjacent sections. F and G are from the rostral pole of the SCN; H and I are from the mid-caudal SCN. Wisps of fiber labeling dorsal to the main SCN field in H lie within the vSPZ. Scale bar = 100 μm in A, C (applies to C–E), and F (applies to F–I); 10 μm in B.
Fig. 6
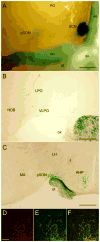
Hypothalamic and other basal limbic targets beyond the SCN. A: Basal view of X-gal-stained whole brain. Top of image is rostral and the right margin is near the midline. The optic chiasm and the right optic nerve and tract (left in image) have been retracted caudally to expose the right SCN and pSON. A few fibers are also evident in the preoptic region. B,C: X-gal staining in coronal sections just rostral (B) or caudal (C) to the SCN, showing scattered fibers in the preoptic area including the VLPO (B), dense input to the peri-SON (C), and scattered labeling in the anterior and lateral hypothalamus and medial amygdala (C). D–F: Confocal immunofluorescence images of the ventral SPZ illustrating relationship between crossed retinal afferents (red; D) and afferents from melanopsin RGCs (green, E). Format as in Figure 5C–E; F is the merged image. Many but not all of the crossed retinal afferents arise from β-galactosidase-positive (melanopsin) afferents. For abbreviations, see list. Scale bar = 500 μm in A and C; 200 μm in B; 25 μm in D (applies to D–F).
Fig. 7
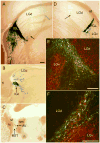
Distribution of afferents from melanopsin ganglion cells in lateral geniculate complex. A–D: Coronal sections reacted with X-gal. A and D are from middle of rostrocaudal extent of LGd. A is contralateral and D is ipsilateral to the remaining eye in a monocularly enucleated mouse. Black arrows indicate sparse terminal labeling near the ventromedial margin of LGd. White arrow in A indicates axon of passage in one of the fascicles traversing the LGd. B shows substantial terminal labeling at the rostral margin of the LGd as well as strong labeling of the IGL at this level. C shows the rostral limit of this terminal field in or near the BST. E,F: Confocal merged immunofluorescence images of the IGL and adjacent geniculate nuclei illustrating relationship between afferents from mRGCs of both eyes (green) and total retinal afferents (red) from one eye, either the contralateral eye (E) or the ipsilateral eye (F). Most retinal afferents to the IGL are from melanopsin RGCs (green and yellow puncta), but many are not (red puncta). Green profiles (without red) represent terminations of axons from mRGCs in the eye not injected with CTB. Most retinal afferents to the LGv do not arise from melanopsin RGCs. For abbreviations, see list. Scale bar = 100 μm in A–F.
Fig. 8
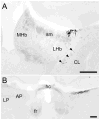
X-gal-stained coronal sections illustrating inputs to the region of the habenula and posterior limitans nucleus. A: Mid-habenular level; midline is at the left edge of the image. The main terminal field lies at dorsolateral margin of the stria medullaris and lateral habenula, with scattered fibers (arrowheads) within the fiber capsule bounding the habenular complex ventrolaterally. B: The caudal end of the terminal field, at the level of the habenular commissure. The plexus of labeled fibers on the right lies at the dorsal surface near the boundary of the midbrain (represented by the anterior pretectal nucleus) and the thalamus (represented by the lateral posterior nucleus), in a region included within the posterior limitans nucleus in other rodents. The right eye was enucleated in this animal, leading to nearly complete loss of labeled axons on the left. For abbreviations, see list. Scale bar = 200 μm in A,B.
Fig. 9
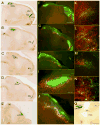
Distribution of afferents from melanopsin ganglion cells within the olivary pretectal nucleus (OPN), caudal IGL, and periaqueductal grey. A–E: Coronal series through the OPN stained with X-gal; section A is most rostral. F–J: Double-immunofluorescence micrographs of coronal sections illustrating relationship of afferents from melanopsin ganglion cells (red anti-β-galactosidase) with overall crossed retinal input (green CTB). F, G, and H are at roughly the same level as A, C, and D, respectively. I and J are higher power views of F and H, respectively. K,L: Confocal merged double-immunofluorescence images of the left OPN and adjacent pretectal nuclei illustrating the relationship between afferents from melanopsin RGCs (green; anti-β-galactosidase) and contralateral retinal afferents (red; anti-CTB; note that assignment of fluorophores is reversed from that in F–J). L is an enlarged, higher resolution scan of the boxed area in K. Note that the OPN, as defined by input from melanopsin afferents, is a small part of a much larger field of crossed retinal input (K). In L, most melanopsin afferents in the OPN contain anterograde label transported from the contralateral eye (green + red = yellow), but the terminal at the bottom right lacks red anti-CTB labeling and presumably arises from the ipsilateral eye. M,N: The same as K and L, but from the other side of the brain (right), so that anterograde CTB label (red) marks inputs from the ipsilateral eye. N is enlarged from the boxed region in M. In M, note the modest overlap between the field of melanopsin afferents (green) and the patch of uncrossed retinal input (red). Most melanopsin afferents in N lack anterograde label, presumably because they come from the contralateral eye. Within the OPN as defined by the melanopsin afferent terminal field, many retinal afferents, both crossed (K,L) and uncrossed (M,N), lack β-galactosidase (red +, green −) and thus presumably arise from non-melanopsin ganglion cells. O: Coronal section through the OPN stained with X-gal after enucleation of the left eye. Note the pronounced reduction in the labeled terminal field contralateral to the enucleation (right). On the left, fibers descending from the OPN penetrate the posterior commissure (pc) to enter the periaqueductal gray (PAG). For abbreviations, see list. Scale bar = 500 μm in A (applies to A–E), F (applies to F–H), and O; 200 μm in K (applies to K–M); 100 μm in I,J.
Fig. 10
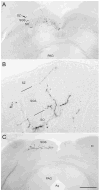
Coronal sections illustrating X-gal staining of melanopsin afferents to the superior colliculus. The left eye was enucleated, leaving only right-eye afferents intact. A: Rostral superior colliculus. Fiber labeling is heaviest in the stratum opticum (SO), especially medially and laterally, but some fibers invade the stratum griseum superficiale (SGS) and stratum zonale (SZ). B: Higher magnification view of left colliculus in a similar section from a different brain. C: Caudal pole of superior colliculus, from the same brain as shown in A. In A and C, a few melanopsin afferents from the ipsilateral eye are apparent in the right colliculus. For abbreviations, see list. Scale bar in C = 500 μm in A,C and 200 μm in B.
Similar articles
- Two types of melanopsin retinal ganglion cell differentially innervate the hypothalamic suprachiasmatic nucleus and the olivary pretectal nucleus.
Baver SB, Pickard GE, Sollars PJ, Pickard GE. Baver SB, et al. Eur J Neurosci. 2008 Apr;27(7):1763-70. doi: 10.1111/j.1460-9568.2008.06149.x. Epub 2008 Mar 25. Eur J Neurosci. 2008. PMID: 18371076 - A broad role for melanopsin in nonvisual photoreception.
Gooley JJ, Lu J, Fischer D, Saper CB. Gooley JJ, et al. J Neurosci. 2003 Aug 6;23(18):7093-106. doi: 10.1523/JNEUROSCI.23-18-07093.2003. J Neurosci. 2003. PMID: 12904470 Free PMC article. - Target areas innervated by PACAP-immunoreactive retinal ganglion cells.
Hannibal J, Fahrenkrug J. Hannibal J, et al. Cell Tissue Res. 2004 Apr;316(1):99-113. doi: 10.1007/s00441-004-0858-x. Epub 2004 Feb 26. Cell Tissue Res. 2004. PMID: 14991397 - Melanopsin--shedding light on the elusive circadian photopigment.
Brown RL, Robinson PR. Brown RL, et al. Chronobiol Int. 2004 Mar;21(2):189-204. doi: 10.1081/cbi-120037816. Chronobiol Int. 2004. PMID: 15332341 Free PMC article. Review. - Strange vision: ganglion cells as circadian photoreceptors.
Berson DM. Berson DM. Trends Neurosci. 2003 Jun;26(6):314-20. doi: 10.1016/S0166-2236(03)00130-9. Trends Neurosci. 2003. PMID: 12798601 Review.
Cited by
- Circadian Responses to Light-Flash Exposure: Conceptualization and New Data Guiding Future Directions.
Wong KY, Fernandez FX. Wong KY, et al. Front Neurol. 2021 Feb 11;12:627550. doi: 10.3389/fneur.2021.627550. eCollection 2021. Front Neurol. 2021. PMID: 33643205 Free PMC article. - The C-Terminus and Third Cytoplasmic Loop Cooperatively Activate Mouse Melanopsin Phototransduction.
Valdez-Lopez JC, Petr ST, Donohue MP, Bailey RJ, Gebreeziabher M, Cameron EG, Wolf JB, Szalai VA, Robinson PR. Valdez-Lopez JC, et al. Biophys J. 2020 Jul 21;119(2):389-401. doi: 10.1016/j.bpj.2020.06.013. Epub 2020 Jun 23. Biophys J. 2020. PMID: 32621866 Free PMC article. - Eye-specific visual processing in the mouse suprachiasmatic nuclei.
Walmsley L, Brown TM. Walmsley L, et al. J Physiol. 2015 Apr 1;593(7):1731-43. doi: 10.1113/jphysiol.2014.288225. Epub 2015 Feb 27. J Physiol. 2015. PMID: 25652666 Free PMC article. - Light-induced synchronization of the SCN coupled oscillators and implications for entraining the HPA axis.
Li Y, Androulakis IP. Li Y, et al. Front Endocrinol (Lausanne). 2022 Oct 27;13:960351. doi: 10.3389/fendo.2022.960351. eCollection 2022. Front Endocrinol (Lausanne). 2022. PMID: 36387856 Free PMC article. - Contributions of VLDLR and LRP8 in the establishment of retinogeniculate projections.
Su J, Klemm MA, Josephson AM, Fox MA. Su J, et al. Neural Dev. 2013 Jun 13;8:11. doi: 10.1186/1749-8104-8-11. Neural Dev. 2013. PMID: 23758727 Free PMC article.
References
- Abrahamson EE, Moore RY. Suprachiasmatic nucleus in the mouse: retinal innervation, intrinsic organization and efferent projections. Brain Res. 2001;916:172–191. - PubMed
- Alvarez-Lopez C, Cernuda-Cernuda R, Paniagua MA, Alvarez-Viejo M, Fernandez-Lopez A, Garcia-Fernandez JM. The transcription factor CREB is phosphorylated in neurons of the piriform cortex of blind mice in response to illumination of the retina. Neurosci Lett. 2004;357:223–226. - PubMed
- Barash S, Melikyan A, Sivakov A, Tauber M. Shift of visual fixation dependent on background illumination. J Neurophysiol. 1998;79:2766–2781. - PubMed
- Belenky MA, Smeraski CA, Provencio I, Sollars PJ, Pickard GE. Melanopsin retinal ganglion cells receive bipolar and amacrine cell synapses. J Comp Neurol. 2003;460:380–393. - PubMed
Publication types
MeSH terms
Substances
Grants and funding
- R01 EY006837/EY/NEI NIH HHS/United States
- R01 EY017137/EY/NEI NIH HHS/United States
- R01 EY006837-19/EY/NEI NIH HHS/United States
- R01 EY006837-18/EY/NEI NIH HHS/United States
- R01 EY014596/EY/NEI NIH HHS/United States
- 5 R01 EY012793/EY/NEI NIH HHS/United States
- R01 EY014596-03/EY/NEI NIH HHS/United States
- 5R01 EY014596/EY/NEI NIH HHS/United States
- R01 EY014596-01/EY/NEI NIH HHS/United States
- R01 EY006837-17/EY/NEI NIH HHS/United States
- R01 EY012793/EY/NEI NIH HHS/United States
- R01 DC006904-02/DC/NIDCD NIH HHS/United States
- R01 EY006837-16A1/EY/NEI NIH HHS/United States
- R01 EY014596-04/EY/NEI NIH HHS/United States
- R01 EY014596-02/EY/NEI NIH HHS/United States
- R01 EY006837-20A1/EY/NEI NIH HHS/United States
- R01 DC006904-01/DC/NIDCD NIH HHS/United States
- R01 DC006904/DC/NIDCD NIH HHS/United States
LinkOut - more resources
Full Text Sources
Research Materials
Miscellaneous


