The G protein-coupled receptor subset of the chicken genome - PubMed (original) (raw)
The G protein-coupled receptor subset of the chicken genome
Malin C Lagerström et al. PLoS Comput Biol. 2006.
Abstract
G protein-coupled receptors (GPCRs) are one of the largest families of proteins, and here we scan the recently sequenced chicken genome for GPCRs. We use a homology-based approach, utilizing comparisons with all human GPCRs, to detect and verify chicken GPCRs from translated genomic alignments and Genscan predictions. We present 557 manually curated sequences for GPCRs from the chicken genome, of which 455 were previously not annotated. More than 60% of the chicken Genscan gene predictions with a human ortholog needed curation, which drastically changed the average percentage identity between the human-chicken orthologous pairs (from 56.3% to 72.9%). Of the non-olfactory chicken GPCRs, 79% had a one-to-one orthologous relationship to a human GPCR. The Frizzled, Secretin, and subgroups of the Rhodopsin families have high proportions of orthologous pairs, although the percentage of amino acid identity varies. Other groups show large differences, such as the Adhesion family and GPCRs that bind exogenous ligands. The chicken has only three bitter Taste 2 receptors, and it also lacks an ortholog to human TAS1R2 (one of three GPCRs in the human genome in the Taste 1 receptor family [TAS1R]), implying that the chicken's ability and mode of detecting both bitter and sweet taste may differ from the human's. The chicken genome contains at least 229 olfactory receptors, and the majority of these (218) originate from a chicken-specific expansion. To our knowledge, this dataset of chicken GPCRs is the largest curated dataset from a single gene family from a non-mammalian vertebrate. Both the updated human GPCR dataset, as well the chicken GPCR dataset, are available for download.
Conflict of interest statement
Competing interests. The authors have declared that no competing interests exist.
Figures
Figure 1. Flowchart Describing the Sequence Analysis Strategy Used in This Work
Briefly, in the first step, a Genscan dataset was created from the Ensembl February 2004 assembly of the chicken genome. These 30,165 predicted proteins were then searched against a human reference set using BLAST, and 53,294 proteins were selected as possible GPCRs. After removal of multiple hits, 1,116 potential proteins remained. After elimination of non-GPCRs, all 870 GPCR-like sequences were manually inspected and corrected, pseudogenes were removed, and multiple hits representing the same protein were merged. With the completion of step 1, the sequences of 390 new chicken GPCRs were identified. In step 2, a set of 505 putative chicken GPCRs were aligned together with a human reference set to the chicken genome. All sites with a human hit, but without a chicken hit, were extracted and manually processed. Step 2 identified 25 possible chicken GPCRs. In step 3, an initial phylogenetic analysis was performed to identify possible missing orthologs. These human receptor proteins were searched against the chicken genome. All hits with an _E_-value of better than E = 1e−6 were compared to all collected chicken GPCRs. A total of 22 new chicken GPCRs were identified in this way after manual assembly and verification. In the fourth and final step, 18 additional chicken GPCR-like sequences were identified using crude searches against the chicken genome with a selection of human GPCRs as baits. All hits with an _E_-value of better than E = 0.1 were manually compared with all previously identified chicken GPCRs. In total, 455 new potential GPCR-like sequences were identified using this approach.
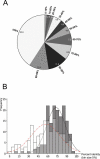
Figure 2. Comparison between Curated and Non-Curated Chicken GPCR Sequences
(A) The chart describes the percentage identity between the original Genscan prediction and the manually curated version of the chicken proteins for 158 sequence pairs. The segment labeled 100% contains those proteins that were correctly predicted by Genscan, while the segment labeled 0%–10% contains those pairs that had almost no correctly predicted material. (B) A histogram describing the percentage identity between 158 human–chicken orthologous pairs as identified from the phylogenetic trees. The solid line and the grey bars represent the comparison between the manually edited chicken proteins and the human orthologs, while the dotted line and the white bars represent the comparison between the human proteins and the non-edited Genscan predictions. The mean percentage identities are 72.9% (standard deviation 14.9) and 56.3% (standard deviation 22.7) for the comparison with the edited and non-edited chicken sequences, respectively. The datasets fit a normal distribution with p = 0.04 and p = 0.08, respectively, using the Kolmogorov–Smirnov test (MiniTab). The lines in the graphs are fitted assuming normal distribution.
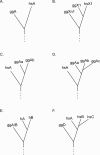
Figure 3. The Nomenclature Definitions That We Used to Classify the Various Outcomes of the Phylogenetic Relationships between the Chicken and Human GPCRs
(A) Orthologs. The chicken sequence will inherit the human sequence name with “gg” (G. gallus) as prefix (according to the guidelines of CHICKBASE hosted at the Roslin Institute). (B) One orthologous pair in receptor family X together with a missing human ortholog. The chicken sequence will inherit the receptor family name “X” together with the appendix “n1” (novel 1); for example, see Figure 5A ggGPR119n1. (C) Gene duplication in the chicken genome/gene loss in the human genome. The chicken sequences will inherit the human sequence name. The two chicken sequences will be discriminated by “a, b” appendix; for example, see Figure 5A ggADORA2Ba and ggADORA2Bb. (D) Gene expansion in the chicken genome/gene loss in the human genome (n > 2). The chicken sequences will inherit the name of the closest human sequence. The chicken sequences will be discriminated by appendix “a, b, c …”; for example, see Figure 5D ggGPR43n1a–1h. (E) Gene duplication in the human genome/gene loss in the chicken genome. The chicken sequence will inherit a combination of the two human sequence names; for example, see Figure 4A ggGPR111/115. (F) Gene expansion in the human genome/gene loss in the chicken genome (n > 2). The chicken gene will be given a novel name associated with the closest human receptor family; for example, see Figure 5D ggMRGn1.
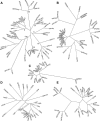
Figure 4. Phylogenetic Relationship between Human and Chicken GPCR Sequences
Phylogenetic analysis was performed by first calculating neighbor-joining trees (except for Figure 4A where a maximum-parsimony topology was used) with 100 bootstrap replicas for each of the ten groups described in Table 1 and then mapping maximum-likelihood branch lengths onto the topology using TreePuzzle. The trees were visualized in TreeView [94]. Dotted lines represent the position of a receptor protein with a partial TM region. These positions are based on a separate calculation. (A) The Adhesion receptor family. I–VIII represents the different groups of the Adhesion family [15]. (B) The Glutamate receptor family. (C) FZD. (D) TAS2R. (E) The Secretin receptor family. A single asterisk indicates that the position is based on sequence alignment with the human GCGR. Only a fragment of the N-terminus was found. A double asterisk indicates possible pseudogene.
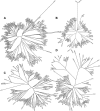
Figure 5. Phylogenetic Relationship between Human and Chicken GPCR Sequences
Phylogenetic analysis was performed by first calculating neighbor-joining trees with 100 bootstrap replicas for each of the ten groups described in Table 1, and then mapping maximum-likelihood branch lengths onto the neighbor-joining topology using TreePuzzle. The trees were visualized in TreeView [94]. Dotted lines represent the position of a receptor protein with a partial TM region. These positions are based on a separate calculation. The Rhodopsin family receptors are shown. (A) The α-group of Rhodopsin family receptors. (B) The β-group of Rhodopsin family receptors. (C) The γ-group of Rhodopsin receptor family. (D) The δ-group of Rhodopsin receptor family.
Similar articles
- The G protein-coupled receptor subset of the rat genome.
Gloriam DE, Fredriksson R, Schiöth HB. Gloriam DE, et al. BMC Genomics. 2007 Sep 25;8:338. doi: 10.1186/1471-2164-8-338. BMC Genomics. 2007. PMID: 17892602 Free PMC article. - Comprehensive repertoire and phylogenetic analysis of the G protein-coupled receptors in human and mouse.
Bjarnadóttir TK, Gloriam DE, Hellstrand SH, Kristiansson H, Fredriksson R, Schiöth HB. Bjarnadóttir TK, et al. Genomics. 2006 Sep;88(3):263-73. doi: 10.1016/j.ygeno.2006.04.001. Epub 2006 Jun 6. Genomics. 2006. PMID: 16753280 - The amphioxus (Branchiostoma floridae) genome contains a highly diversified set of G protein-coupled receptors.
Nordström KJ, Fredriksson R, Schiöth HB. Nordström KJ, et al. BMC Evol Biol. 2008 Jan 16;8:9. doi: 10.1186/1471-2148-8-9. BMC Evol Biol. 2008. PMID: 18199322 Free PMC article. - Mining the gene repertoire and ESTs for G protein-coupled receptors with evolutionary perspective.
Schiöth HB, Nordström KJ, Fredriksson R. Schiöth HB, et al. Acta Physiol (Oxf). 2007 May;190(1):21-31. doi: 10.1111/j.1365-201X.2007.01694.x. Acta Physiol (Oxf). 2007. PMID: 17428229 Review. - The adhesion GPCRs; gene repertoire, phylogeny and evolution.
Schiöth HB, Nordström KJ, Fredriksson R. Schiöth HB, et al. Adv Exp Med Biol. 2010;706:1-13. doi: 10.1007/978-1-4419-7913-1_1. Adv Exp Med Biol. 2010. PMID: 21618822 Review.
Cited by
- The role of GPCRs in bone diseases and dysfunctions.
Luo J, Sun P, Siwko S, Liu M, Xiao J. Luo J, et al. Bone Res. 2019 Jul 8;7:19. doi: 10.1038/s41413-019-0059-6. eCollection 2019. Bone Res. 2019. PMID: 31646011 Free PMC article. Review. - Evolution of secretin family GPCR members in the metazoa.
Cardoso JC, Pinto VC, Vieira FA, Clark MS, Power DM. Cardoso JC, et al. BMC Evol Biol. 2006 Dec 13;6:108. doi: 10.1186/1471-2148-6-108. BMC Evol Biol. 2006. PMID: 17166275 Free PMC article. - Genome-Wide Identification of G Protein-Coupled Receptors in Ciliated Eukaryotes.
Luo S, Zhang P, Miao W, Xiong J. Luo S, et al. Int J Mol Sci. 2023 Feb 15;24(4):3869. doi: 10.3390/ijms24043869. Int J Mol Sci. 2023. PMID: 36835283 Free PMC article. - Genomic insight into the nocturnal adaptation of the black-crowned night heron (Nycticorax nycticorax).
Luo H, Luo S, Fang W, Lin Q, Chen X, Zhou X. Luo H, et al. BMC Genomics. 2022 Oct 3;23(1):683. doi: 10.1186/s12864-022-08904-y. BMC Genomics. 2022. PMID: 36192687 Free PMC article. - The repertoire of G protein-coupled receptors in the sea squirt Ciona intestinalis.
Kamesh N, Aradhyam GK, Manoj N. Kamesh N, et al. BMC Evol Biol. 2008 May 1;8:129. doi: 10.1186/1471-2148-8-129. BMC Evol Biol. 2008. PMID: 18452600 Free PMC article.
References
- Lander ES, Linton LM, Birren B, Nusbaum C, Zody MC, et al. Initial sequencing and analysis of the human genome. Nature. 2001;409:860–921. - PubMed
- Venter JC, Adams MD, Myers EW, Li PW, Mural RJ, et al. The sequence of the human genome. Science. 2001;291:1304–1351. - PubMed
- Hillier LW, Miller W, Birney E, Warren W, Hardison RC, et al. Sequence and comparative analysis of the chicken genome provide unique perspectives on vertebrate evolution. Nature. 2004;432:695–716. - PubMed
- International Human Genome Sequencing Consortium. Finishing the euchromatic sequence of the human genome. Nature. 2004;431:931–945. - PubMed
- Larsson TP, Murray CG, Hill T, Fredriksson R, Schioth HB. Comparison of the current RefSeq, Ensembl and EST databases for counting genes and gene discovery. FEBS Lett. 2005;579:690–698. - PubMed
Publication types
MeSH terms
Substances
LinkOut - more resources
Full Text Sources


