The Arabidopsis SUPPRESSOR OF AUXIN RESISTANCE proteins are nucleoporins with an important role in hormone signaling and development - PubMed (original) (raw)
The Arabidopsis SUPPRESSOR OF AUXIN RESISTANCE proteins are nucleoporins with an important role in hormone signaling and development
Geraint Parry et al. Plant Cell. 2006 Jul.
Abstract
Nucleocytoplasmic transport of macromolecules is regulated by a large multisubunit complex called the nuclear pore complex (NPC). Although this complex is well characterized in animals and fungi, there is relatively little information on the NPC in plants. The suppressor of auxin resistance1 (sar1) and sar3 mutants were identified as suppressors of the auxin-resistant1 (axr1) mutant. Molecular characterization of these genes reveals that they encode proteins with similarity to vertebrate nucleoporins, subunits of the NPC. Furthermore, a SAR3-green fluorescent protein fusion protein localizes to the nuclear membrane, indicating that SAR1 and SAR3 are Arabidopsis thaliana nucleoporins. Plants deficient in either protein exhibit pleiotropic growth defects that are further accentuated in sar1 sar3 double mutants. Both sar1 and sar3 mutations affect the localization of the transcriptional repressor AXR3/INDOLE ACETIC ACID17, providing a likely explanation for suppression of the phenotype conferred by axr1. In addition, sar1 sar3 plants accumulate polyadenylated RNA within the nucleus, indicating that SAR1 and SAR3 are required for mRNA export. Our results demonstrate the important role of the plant NPC in hormone signaling and development.
Figures
Figure 1.
The sar3-1 Mutation Suppresses Aspects of the Phenotype Conferred by axr1. (A) Wild-type and mutant seedlings were grown for 9 d in the light at 22°C (white bars) or 29°C (black bars). Error bars represent
sd
(n = 20 or greater). (B) Root elongation (white bars) of wild-type and mutant seedlings grown on 0.16 μM 2,4-D. Four-day-old seedlings were transferred to medium with hormone, and growth was measured after 3 d. Values are expressed as percentages of root growth of each genotype on medium without hormone (n = 12 or greater). Black bars represent lateral roots on 10-d-old seedlings grown on ATS medium (n = 10 or greater). Error bars represent
se
. (C) RT-PCR on RNA extracted from 10-d-old wild-type and mutant seedlings treated with or without 20 μM 2,4-D for 1 h. Primers for the IAA1 and IAA5 genes were used to demonstrate auxin-induced gene expression. Primers from ACTIN2 were used as a control. (D) Appearance of 5-week-old wild-type and mutant plants. Bar = 5 cm.
Figure 2.
The sar1 and sar3 Mutations Suppress Auxin Resistance Exhibited by rce1 Plants. (A) Root elongation of wild-type and mutant seedlings grown on 0.16 μM 2,4-D. The experiment was performed as described for Figure 1B. Student's t test indicated that the values for rce1 and sar1 rce1 are significantly different (P < 0.05). Error bars represent
se
(n = 10 or greater). Ler, Landsberg erecta. (B) Phenotypes of 5-week-old wild-type and mutant plants. Bar = 2 cm. (C) Immunoblot using anti-CUL1 antibody on total protein extracted from floral tissue. Arrows indicate RUB-modified (top) and unmodified (bottom) forms of CUL1. The bottom gel shows an unknown nonspecific band used as a loading control.
Figure 3.
SAR3 Is Similar to Vertebrate NUP96. (A) Structure of the SAR3 gene. Boxes represent exons. The asterisk denotes the position of deletions in sar3-1 and sar3-2; the position of the T-DNA insertion in sar3-3 is represented by an inverted triangle. Lines A and B correspond to regions amplified from the cDNA by primers used in (B). (B) RT-PCR of SAR3 transcript using RNA from a variety of tissues and in sar3 mutant alleles using internal primers within the SAR3 and ACTIN2 genes. Roots are from 12-d-old seedlings, and leaves are rosette leaves from 27-d-old plants. Regions amplified by primers A and B are represented in (A). (C) Alignment of the amino acid sequence of SAR3 (1046 residues) and the C-terminal 1130 residues from human NUP196 (residues 670 to 1800). This sequence represents the C-terminal 196 amino acids of the human NUP98 protein and the entire sequence of human NUP96. The site of autoproteolytic cleavage in NUP196 is underlined. The asterisk denotes the first amino acid (S) of NUP96. Boxed regions have >30% identity. Black shading denotes identical residues.
Figure 4.
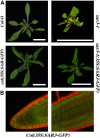
SAR3-GFP Is Localized to the Nuclear Periphery. (A) Rosettes of 25-d-old wild-type and sar3-1 plants with or without the 35S:SAR3-GFP transgene. Bars = 2 cm. (B) Confocal images of cells from the root tip (left) and the root elongation zone (right) from Col-0 35S:SAR3-GFP. Green signal represents GFP expression, and cell walls are stained with propidium iodide.
Figure 5.
SAR1 Is Similar to Vertebrate NUP160. (A) Structure of the SAR1 gene. Boxes represent exons. Asterisks denote the positions of missense mutations in sar1-1, sar1-2, and sar1-3. The position of the T-DNA insertion in sar1-4 is represented by an inverted triangle. Lines A to C correspond to regions amplified from the cDNA by primers used in (C). (B) Phenotypes of 5-week-old wild-type and sar1 plants. Bar = 10 cm. (C) RT-PCR of SAR1 from a variety of tissue types and in sar1 mutant alleles using internal primers within the SAR1 and ACTIN2 genes. Tissues are as described for Figure 3B. Regions amplified by primers A to C are shown in (A). (D) Alignment of amino acid sequence from SAR1 (residues 1028 to 1406) and human NUP160 (residues 962 to 1316). Black shading denotes identical residues.
Figure 6.
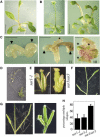
Loss of Both SAR1 and SAR3 Results in Severe Defects in Development. (A) Phenotype of a 19-d-old plant homozygous for sar1-1 and heterozygous for sar3-1. Bar = 5 mm. (B) Examples of class B sar1-1 sar3-1 mutants. These are the most robust double mutant plants. Bars = 2 mm. (C) Examples of class A sar1-1 sar3-1 seedlings. Arrows in (i) and (ii) show positions of cotyledons, and asterisks in (ii) and (iii) show locations of abortive true leaves. Bars = 1 mm. (D) Phenotype of a 45-d-old sar1-1 sar3-1 plant exhibiting a long primary inflorescence and numerous short secondary inflorescences. (E) Representative flowers from sar1-1 and sar1-1 sar3-1 plants. Bars = 1 mm. (F) Regular spacing of siliques in a wild-type plant. (G) Examples of the irregular spacing of siliques that occurs in sar1 or sar3 single mutants (left) and sar1-1 sar3-1 double mutants (right). (H) Proportion of total siliques that are irregularly spaced in sar1-1, sar3-1, and sar1-1 sar3-1 mutant plants. Measurement from wild-type plants is omitted, because these do not develop any irregularly spaced siliques. Error bars represent
se
(n = 7 or greater).
Figure 7.
mRNA Accumulates in the Nuclei of sar1-1 sar3-1 Cells. Small leaves (<5 mm) from wild-type Col-0 and sar1-1 sar3-1 plants were fixed and probed with a poly(dT) fluorescein-tagged oligonucleotide. Confocal images were taken of larger cells close to the main vein (left) or of cells at the center of the leaf (right). Cells were imaged using fluorescein isothiocyanate and tetramethylrhodamine isothiocynate filters, and these images were merged. Green color corresponds to the location of poly(A) RNA, which accumulates to higher levels in the nuclei of sar1-1 sar3-1 cells.
Figure 8.
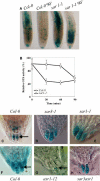
The sar1 and sar3 Mutations Affect the Localization of the AXR3NT:GUS Protein. (A) Seven-day-old HS:AXR3NT:GUS seedlings in a wild-type or sar1 background were heat-shocked at 37°C for 2 h and then placed at 22°C for 90 min. Samples from time 0 or 90 min (90′) were stained with GUS overnight. (B) Seedlings were treated as described for (A). Protein extracted from seedlings at each time point was tested in a MUG fluorescence assay. The amount of fluorescence produced in each sample was expressed as a percentage of the fluorescence at the end of the heat-shock period. Values reported are means of two determinations. Similar results were obtained in a second, independent experiment. (C) to (H) HS:AXR3NT:GUS seedlings in a wild-type or mutant background were heat-shocked at 37°C for 2 h and then stained with GUS solution for 45 min ([C] to [E], [G], and [H]) or 2 h (F). Images show GUS expression in the root tip region, and arrows indicate the positions of nuclei.
Similar articles
- A loss-of-function mutation in the nucleoporin AtNUP160 indicates that normal auxin signalling is required for a proper ethylene response in Arabidopsis.
Robles LM, Deslauriers SD, Alvarez AA, Larsen PB. Robles LM, et al. J Exp Bot. 2012 Mar;63(5):2231-41. doi: 10.1093/jxb/err424. Epub 2012 Jan 11. J Exp Bot. 2012. PMID: 22238449 Free PMC article. - Components of the Arabidopsis nuclear pore complex play multiple diverse roles in control of plant growth.
Parry G. Parry G. J Exp Bot. 2014 Nov;65(20):6057-67. doi: 10.1093/jxb/eru346. Epub 2014 Aug 27. J Exp Bot. 2014. PMID: 25165147 Free PMC article. - The scaffold nucleoporins SAR1 and SAR3 are essential for proper meiotic progression in Arabidopsis thaliana.
Fernández-Jiménez N, Martinez-Garcia M, Varas J, Gil-Dones F, Santos JL, Pradillo M. Fernández-Jiménez N, et al. Front Cell Dev Biol. 2023 Dec 4;11:1285695. doi: 10.3389/fcell.2023.1285695. eCollection 2023. Front Cell Dev Biol. 2023. PMID: 38111849 Free PMC article. - Assessing the function of the plant nuclear pore complex and the search for specificity.
Parry G. Parry G. J Exp Bot. 2013 Feb;64(4):833-45. doi: 10.1093/jxb/ers289. Epub 2012 Oct 17. J Exp Bot. 2013. PMID: 23077202 Review. - Nuclear RNA export and its importance in abiotic stress responses of plants.
Chinnusamy V, Gong Z, Zhu JK. Chinnusamy V, et al. Curr Top Microbiol Immunol. 2008;326:235-55. doi: 10.1007/978-3-540-76776-3_13. Curr Top Microbiol Immunol. 2008. PMID: 18630756 Review.
Cited by
- Arabidopsis iba response5 suppressors separate responses to various hormones.
Strader LC, Monroe-Augustus M, Rogers KC, Lin GL, Bartel B. Strader LC, et al. Genetics. 2008 Dec;180(4):2019-31. doi: 10.1534/genetics.108.091512. Epub 2008 Oct 1. Genetics. 2008. PMID: 18832358 Free PMC article. - Dynamics of the plant nuclear envelope and nuclear pore.
Boruc J, Zhou X, Meier I. Boruc J, et al. Plant Physiol. 2012 Jan;158(1):78-86. doi: 10.1104/pp.111.185256. Epub 2011 Sep 26. Plant Physiol. 2012. PMID: 21949214 Free PMC article. Review. No abstract available. - LONO1 encoding a nucleoporin is required for embryogenesis and seed viability in Arabidopsis.
Braud C, Zheng W, Xiao W. Braud C, et al. Plant Physiol. 2012 Oct;160(2):823-36. doi: 10.1104/pp.112.202192. Epub 2012 Aug 16. Plant Physiol. 2012. PMID: 22898497 Free PMC article. - NUA Activities at the Plant Nuclear Pore.
Xu XM, Rose A, Meier I. Xu XM, et al. Plant Signal Behav. 2007 Nov;2(6):553-5. doi: 10.4161/psb.2.6.4836. Plant Signal Behav. 2007. PMID: 19704557 Free PMC article. - Arabidopsis CPR5 plays a role in regulating nucleocytoplasmic transport of mRNAs in ethylene signaling pathway.
Chen J, Sui X, Ma B, Li Y, Li N, Qiao L, Yu Y, Dong CH. Chen J, et al. Plant Cell Rep. 2022 Apr;41(4):1075-1085. doi: 10.1007/s00299-022-02838-1. Epub 2022 Feb 24. Plant Cell Rep. 2022. PMID: 35201411
References
- Abel, S., Nguyen, M.D., and Theologis, A. (1995). The PS-IAA4/5-like family of early auxin-inducible mRNAs in Arabidopsis thaliana. J. Mol. Biol. 251 533–549. - PubMed
- Alonso, J.M., et al. (2003). Genome-wide insertional mutagenesis of Arabidopsis thaliana. Science 301 653–657. - PubMed
- Bai, S.W., Rouquette, J., Umeda, M., Faigle, W., Loew, D., Sazer, S., and Doye, V. (2004). The fission yeast Nup107–120 complex functionally interacts with the small GTPase Ran/Spi1 and is required for mRNA export, nuclear pore distribution, and proper cell division. Mol. Cell. Biol. 24 6379–6392. - PMC - PubMed
Publication types
MeSH terms
Substances
LinkOut - more resources
Full Text Sources
Other Literature Sources
Molecular Biology Databases
Research Materials


