Why do hubs tend to be essential in protein networks? - PubMed (original) (raw)
Why do hubs tend to be essential in protein networks?
Xionglei He et al. PLoS Genet. 2006.
Abstract
The protein-protein interaction (PPI) network has a small number of highly connected protein nodes (known as hubs) and many poorly connected nodes. Genome-wide studies show that deletion of a hub protein is more likely to be lethal than deletion of a non-hub protein, a phenomenon known as the centrality-lethality rule. This rule is widely believed to reflect the special importance of hubs in organizing the network, which in turn suggests the biological significance of network architectures, a key notion of systems biology. Despite the popularity of this explanation, the underlying cause of the centrality-lethality rule has never been critically examined. We here propose the concept of essential PPIs, which are PPIs that are indispensable for the survival or reproduction of an organism. Our network analysis suggests that the centrality-lethality rule is unrelated to the network architecture, but is explained by the simple fact that hubs have large numbers of PPIs, therefore high probabilities of engaging in essential PPIs. We estimate that approximately 3% of PPIs are essential in the yeast, accounting for approximately 43% of essential genes. As expected, essential PPIs are evolutionarily more conserved than nonessential PPIs. Considering the role of essential PPIs in determining gene essentiality, we find the yeast PPI network functionally more robust than random networks, yet far less robust than the potential optimum. These and other findings provide new perspectives on the biological relevance of network structure and robustness.
Conflict of interest statement
Competing interests. The authors have declared that no competing interests exist.
Figures
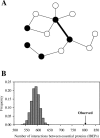
Figure 1. Essential Edges (Interactions) in PPI Networks
(A) A hypothetical PPI network of 12 proteins. Black and white nodes refer to essential and nonessential proteins, respectively. Thick and thin edges depict essential and nonessential interactions, respectively. Proteins linked by an essential interaction must be essential, whereas an interaction between essential proteins (IBEP) may or may not be essential. (B) More IBEPs in the yeast PPI network than in randomly rewired networks. “Observed” indicates the observed number (807) of IBEPs in the real network. The gray bars show the distribution of the number (m) of IBEPs in 10,000 randomly rewired networks.
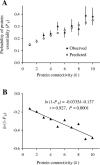
Figure 2. The Relationship between the Probability That a Protein Is Essential (P E) and the Connectivity (k) of the Protein
(A) Observed and predicted P E values. The observed values were estimated from the yeast PPI network and the predicted values were computed using Equation 1 with parameters α = 2.92% and β = 12.6%. Error bars show one standard (sampling) error of the observed values. (B) Linear regression between ln(1-P E) and k. Using Equation 2, we estimated from the regression that α = 3.29% and β = 12.8%. The 95% confidence interval for α is between 2.23%–4.35%. The 95% confidence interval for β is between 6.7%–18.6%. Proteins with k > 10 (~ 5% of all proteins) are not considered because of small sample sizes.
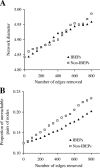
Figure 3. Effects of Random Removal of Edges on the Global Structure of the Yeast PPI Network
(A) Effects on network diameter, which is the mean shortest path length among all reachable pairs of nodes in the network. (B) Effects on the proportion of unreachable pairs of nodes in the network. Note that the total number of IBEPs is 807 in the network.
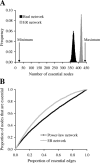
Figure 4. Robustness of PPI Networks
(A) Numbers of essential nodes generated by 220 essential edges in various networks. Black and gray bars depict the distribution of the number of essential nodes from 10,000 replications of random assignments of 220 essential edges to the real yeast PPI network and simulated ER networks, respectively. An ER network has the same number of nodes and edges as in the real network, but the distribution of node connectivity follows a Poisson distribution. Also shown are the minimal and maximal numbers of essential nodes produced by 220 essential edges in any possible network that has the same numbers of nodes and edges as the yeast PPI network. The minimum is 22, because the number of edges among 22 nodes can be as high as 21 × 22/2 = 231 > 220. The maximum is 220 × 2 = 440. (B) Proportions of essential nodes generated by given numbers of essential edges in scale-free (power-law) and ER networks. Both networks contain 4,000 nodes and 4,352 edges. The scale-free network has its node connectivity following the power-law distribution P(k) ∝ k −γ, where P(k) is the probability that a node has k edges. We used γ = 2.29, the same as in the real yeast PPI network (see Figure S4). The ER network has a connectivity distribution following the Poisson distribution with mean connectivity per node being 2.176. The result that more essential nodes are produced in ER networks than in scale-free networks by a given number of essential edges applies to other γ values (see Figure S5).
Similar articles
- Why do hubs in the yeast protein interaction network tend to be essential: reexamining the connection between the network topology and essentiality.
Zotenko E, Mestre J, O'Leary DP, Przytycka TM. Zotenko E, et al. PLoS Comput Biol. 2008 Aug 1;4(8):e1000140. doi: 10.1371/journal.pcbi.1000140. PLoS Comput Biol. 2008. PMID: 18670624 Free PMC article. - Understanding gene essentiality by finely characterizing hubs in the yeast protein interaction network.
Pang K, Sheng H, Ma X. Pang K, et al. Biochem Biophys Res Commun. 2010 Oct 8;401(1):112-6. doi: 10.1016/j.bbrc.2010.09.021. Epub 2010 Sep 15. Biochem Biophys Res Commun. 2010. PMID: 20833129 - Stratus not altocumulus: a new view of the yeast protein interaction network.
Batada NN, Reguly T, Breitkreutz A, Boucher L, Breitkreutz BJ, Hurst LD, Tyers M. Batada NN, et al. PLoS Biol. 2006 Oct;4(10):e317. doi: 10.1371/journal.pbio.0040317. PLoS Biol. 2006. PMID: 16984220 Free PMC article. - On the functional and structural characterization of hubs in protein-protein interaction networks.
Bertolazzi P, Bock ME, Guerra C. Bertolazzi P, et al. Biotechnol Adv. 2013 Mar-Apr;31(2):274-86. doi: 10.1016/j.biotechadv.2012.12.002. Epub 2012 Dec 8. Biotechnol Adv. 2013. PMID: 23228981 Review. - Multi-scale perturbations of protein interactomes reveal their mechanisms of regulation, robustness and insights into genotype-phenotype maps.
Filteau M, Vignaud H, Rochette S, Diss G, Chrétien AÈ, Berger CM, Landry CR. Filteau M, et al. Brief Funct Genomics. 2016 Mar;15(2):130-7. doi: 10.1093/bfgp/elv043. Epub 2015 Oct 17. Brief Funct Genomics. 2016. PMID: 26476431 Review.
Cited by
- Core-genome-mediated promising alternative drug and multi-epitope vaccine targets prioritization against infectious Clostridium difficile.
Aiman S, Farooq QUA, Han Z, Aslam M, Zhang J, Khan A, Ahmad A, Li C, Ali Y. Aiman S, et al. PLoS One. 2024 Jan 19;19(1):e0293731. doi: 10.1371/journal.pone.0293731. eCollection 2024. PLoS One. 2024. PMID: 38241420 Free PMC article. - Counting motifs in the human interactome.
Tran NH, Choi KP, Zhang L. Tran NH, et al. Nat Commun. 2013;4:2241. doi: 10.1038/ncomms3241. Nat Commun. 2013. PMID: 23917172 Free PMC article. - Computational Framework for Prediction of Peptide Sequences That May Mediate Multiple Protein Interactions in Cancer-Associated Hub Proteins.
Sarkar D, Patra P, Ghosh A, Saha S. Sarkar D, et al. PLoS One. 2016 May 24;11(5):e0155911. doi: 10.1371/journal.pone.0155911. eCollection 2016. PLoS One. 2016. PMID: 27218803 Free PMC article. - Identification of key genes and miRNAs markers of papillary thyroid cancer.
Qiu J, Zhang W, Zang C, Liu X, Liu F, Ge R, Sun Y, Xia Q. Qiu J, et al. Biol Res. 2018 Nov 10;51(1):45. doi: 10.1186/s40659-018-0188-1. Biol Res. 2018. PMID: 30414611 Free PMC article. - Investigations into the relationship between feedback loops and functional importance of a signal transduction network based on Boolean network modeling.
Kwon YK, Choi SS, Cho KH. Kwon YK, et al. BMC Bioinformatics. 2007 Oct 15;8:384. doi: 10.1186/1471-2105-8-384. BMC Bioinformatics. 2007. PMID: 17935633 Free PMC article.
References
- Barabasi AL, Albert R. Emergence of scaling in random networks. Science. 1999;286:509–512. - PubMed
- Newman MEJ. The structure and function of complex networks. SIAM Review. 2003;45:167–256.
- Albert R, Jeong H, Barabasi AL. Error and attack tolerance of complex networks. Nature. 2000;406:378–382. - PubMed
- Kamath RS, Fraser AG, Dong Y, Poulin G, Durbin R, et al. Systematic functional analysis of the Caenorhabditis elegans genome using RNAi. Nature. 2003;421:231–237. - PubMed
- Winzeler EA, Shoemaker DD, Astromoff A, Liang H, Anderson K, et al. Functional characterization of the S. cerevisiae genome by gene deletion and parallel analysis. Science. 1999;285:901–906. - PubMed
Publication types
MeSH terms
Substances
LinkOut - more resources
Full Text Sources
Molecular Biology Databases
Research Materials


