A role for alpha1 tubulin-expressing Müller glia in regeneration of the injured zebrafish retina - PubMed (original) (raw)
A role for alpha1 tubulin-expressing Müller glia in regeneration of the injured zebrafish retina
Blake V Fausett et al. J Neurosci. 2006.
Abstract
Alpha1 tubulin (alpha1T) is a neuron-specific microtubule protein whose expression is induced in the developing and regenerating CNS. In the adult CNS, alpha1T expression remains high in neural progenitors. Transgenic zebrafish harboring a 1.7 kb alpha1T promoter fragment along with the first exon and intron express the transgene in a manner that recapitulates expression of the endogenous gene. We recently showed that this promoter mediates gene induction in retinal ganglion cells during optic nerve regeneration and in a subset of Müller glia that proliferate after retinal injury (Senut et al., 2004). To further characterize these Müller glia, we generated transgenic fish harboring an alpha1T promoter fragment that is specifically induced in these cells after retinal damage. Transgene expression, bromodeoxyuridine (BrdU) labeling, and stem cell marker expression suggested that alpha1T-expressing Müller glia dedifferentiate and become multipotent in response to injury. In addition, green fluorescent protein and BrdU-mediated lineage tracing combined with retinal gene expression analysis indicated that alpha1T-expressing Müller glia were capable of generating retinal neurons and glia. These data strongly suggest alpha1T-expressing Müller glia dedifferentiate and mediate regeneration of the injured zebrafish retina.
Figures
Figure 1.
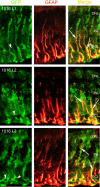
1016α1T:GFP transgenic fish induce GFP expression in Müller glia after retinal injury. Three independent lines of transgenic fish (1016 L1, 1016 L2, 1016 L3) were tested for induction of GFP in the retina 4 d after retinal injury. The panels labeled GFP show transgene GFP expression in Müller-like cells. The middle panels show staining for GFAP, a Müller glial marker. The merged images (right panels) show that GFP-expressing cells also express GFAP (arrows). Retinal ganglion cells do not express GFP in response to injury (arrowheads).
Figure 2.
Injury-induced cell proliferation and GFP expression. a, Graph showing the average number of BrdU+ cells per lesion at 24 h intervals after injury. Four lesions (1–5 dpi) or two lesions (6–7 dpi) were counted to obtain averages. The increase in proliferation in the INL at 2 dpi precedes the increase in proliferation in the ONL at 3 dpi. At 4 dpi, there are ∼850 cells per lesion in the INL that are labeled by BrdU uptake. By 7 dpi, cell proliferation returns to near baseline levels. b, Graph showing the percentage of BrdU+ cells quantified in a that are also GFP+ at each day after injury. c–k, Images of BrdU+/GFP+ cells from 2–5 dpi. c, d, At 1 dpi, few cells were BrdU+, although rare cells considered to be rod progenitors (c) and microglia (d) based on their position within the retina could be identified. Rarely, a GFP+ proliferating cell in the INL could be found (e–g). h, At 2 dpi, a robust induction of GFP in Müller-like cells was observed, which correlates with the rise in the number of BrdU+ cells in the INL at 2 dpi. BrdU+ putative microglia were also present (gray arrow). i, At 3 dpi, more BrdU+/GFP+ cells were observed in the INL. j, At 4 dpi, putative rod progenitors in the ONL can be identified as BrdU+/GFP− cells (gray arrow) and BrdU+/GFP+ cells are abundant (white arrow). In addition, we identified some nuclei that were GFP+/BrdU− (arrowhead). k, At 5 dpi, the number of BrdU+ cells in the INL is decreasing, but GFP+ proliferative cells can be identified in all three nuclear layers (arrows). ♦, ONL; ▪, INL; ▴, GCL.
Figure 3.
1016α1T:GFP expression is specific to Müller glia. Sections from 1016 transgenic 4 d postinjured retinas were examined by confocal microscopy to determine whether GFP expression was induced specifically in Müller glia. Cells were assayed for colocalization of GFP (green panels) with the Müller glial markers GS (red in a) and GFAP (red in b) and the neuronal marker HuC/D (red in c). a, GFP is expressed in Müller cells, which are labeled by GS immunostaining. There are three GFP+ nuclei that appear as GS− holes in this micrograph (arrows). Note the coexpression of GFP and GS in the cytoplasm (arrowheads). Of 205 GFP+ cells assayed for GS expression, 200 (98%) were double labeled. b, GFP-positive cells also express GFAP (arrows). Of 107 GFP+ cells assayed for GFAP expression, 105 (98%) were double labeled. c, Amacrine cells labeled with the neuronal marker HuC/D do not express GFP after injury (wide arrows). Cells double labeled with HuC/D and GFP were never observed at 4 dpi.
Figure 4.
Neurogenic clusters are derived from Müller glia. Sections from 4 dpi retinas were processed for GFP expression (green), and then in situ hybridization for Pax6 mRNA (blue) was performed. a, Pax6 is induced in columns of elongated cells known as neurogenic clusters in response to injury (arrowheads). Amacrine cells normally express Pax6 (arrow; see also d). b, GFP is expressed by Müller glia in response to injury (arrowheads). c, GFP+ cells derived from Müller glia correspond to Pax6-expressing neurogenic clusters (arrowheads). d, Pax6 is expressed in the uninjured retina in amacrine cells (arrow).
Figure 5.
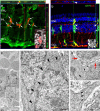
Neurogenic clusters are tightly apposed cells with Müller glial characteristics. a, Sections from 4 dpi retina were processed for BrdU (red) and GFP (green). A stack of confocal images were obtained and used to create images in the z plane (the top and right panels represent slices taken at the green and red lines, respectively). Note the multiple BrdU+ nuclei within the area that corresponds to GFP+ Müller glia (arrows). The inset shows a higher magnification of the BrdU+ (red) nucleus marked with an asterisk in grayscale for greater clarity. Individual nuclei are outlined. b, A representative image from a stack of confocal images taken from 4 dpi retina sections processed for GFP (green) and GS (red) demonstrating multiple nuclei within the area of a single Müller glia (the top and right panels represent slices taken at the red and green lines, respectively). Nuclei that are either surrounded by GFP+ Müller cell processes or are within Müller glia express GFP (white arrows), whereas a nucleus that is outside the GFP+ Müller glia does not (the arrowhead in each panel identifies the same nucleus). The typical glial morphology can be clearly seen in the z plane (right panel, slice taken from the green line) as the cell extends from the ONL to the GCL and contacts the vitreous. A nucleus that appears to be within the Müller cell when viewed in the x–y plane (gray arrow, main panel) is clearly not within the Müller cell when viewed in the z plane (gray arrow, right panel) and does not express GFP. The inset shows a higher magnification of the nucleus marked with an asterisk. c–f, Transmission electron micrographs of a neurogenic cluster at 4 dpi. c, Two nuclei with elongated morphology typical of proliferating neurogenic clusters (asterisks) near the inner plexiform layer. The boxes represent the areas shown at higher magnification in d and e. Scale bar, 3 μm. d, Composite image from two high-magnification micrographs of the cells shown in c demonstrating that these cells are separated by plasma membrane (arrowheads). Scale bar, 500 nm. e, Higher magnification of the area outlined in c. The cytoplasm of the Müller glia (black arrows; see f) is very similar to the cytoplasm of the cells with elongated nuclei (arrowhead), whereas the cytoplasm of other cells is very different (red arrows). The box represents the area shown in f. Scale bar, 500 nm. f, High magnification of the area shown in e demonstrating a junction between Müller glia (arrowheads), indicating that the elongated cells shown in c are surrounded by Müller processes. Scale bar, 500 nm.
Figure 6.
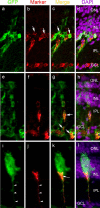
Cells derived from GFP+ Müller glia express markers for differentiating amacrine and retinal ganglion cells. 1016 transgenic fish were injured at day 0 and allowed to recover until 7 or 11 dpi (HuC/D shown at 7 dpi and zn5 at 11 dpi). Sections were stained for HuC/D or zn5 (red), markers for differentiating amacrine and retinal ganglion cells, respectively, and GFP (green) to detect whether GFP+ cells derived from Müller glia begin to differentiate. DAPI is shown in purple to indicate the laminar position of the labeled cells. a–d, Some GFP+ cells begin to express HuC/D at 7 dpi (arrows). e–h, zn5-labeled cells in the IPL and GCL express GFP (arrows). i, A GFP+ Müller-like cell with a thin axon-like projection (arrowheads). j, A zn5-labeled cell extending an axon (arrowheads) into the IPL. k, The zn5+ cell also expresses GFP (arrow). l, The newly born ganglion cell sits at the edge of the INL.
Figure 7.
Cells labeled with BrdU at 4 dpi become new neurons and glia. Fish injured at day 0 received a single injection of BrdU at 4 dpi and were allowed to recover for 180 d. Sections from these retinas were processed for cell-specific markers to identify retinal cell types (red) that were derived from cells labeled with BrdU (green) at 4 dpi. a, BrdU+ cells become cone photoreceptors after injury as indicated by a BrdU-labeled nucleus within a zpr1+ cell (arrow). b, An example of a BrdU+/GS+ Müller glia at 180 dpi (arrow). c, A HuC/D+ amacrine cell derived from a cell labeled with BrdU at 4 dpi (arrow). d, A PKC+ bipolar cell derived from a cell labeled at 4 dpi (arrow). Marker, Cell-specific marker.
Figure 8.
Cells labeled with BrdU at 4 dpi exhibit little proliferation at later times. Fish injured at day 0 were given a single dose of BrdU at 4 dpi and killed at 4, 7, 11, or 180 dpi. Serial sections were collected and processed for BrdU labeling to follow the cells labeled at 4 dpi. The average number of BrdU-labeled cells per lesion is shown for each time point examined. The number of BrdU+ cells in the ONL and INL declines over time, whereas the number of labeled cells in the GCL increases at 7 dpi, suggesting that cells had migrated there. The lack of an increase in the overall number of BrdU-labeled cells over time suggests that cells labeled with BrdU at 4 dpi generally do not continue to progress through the cell cycle. In fact, there is a decline in the total number of cells, suggesting that some of the labeled cells had undergone apoptosis.
Similar articles
- An element in the alpha1-tubulin promoter is necessary for retinal expression during optic nerve regeneration but not after eye injury in the adult zebrafish.
Senut MC, Gulati-Leekha A, Goldman D. Senut MC, et al. J Neurosci. 2004 Sep 1;24(35):7663-73. doi: 10.1523/JNEUROSCI.2281-04.2004. J Neurosci. 2004. PMID: 15342733 Free PMC article. - The proneural basic helix-loop-helix gene ascl1a is required for retina regeneration.
Fausett BV, Gumerson JD, Goldman D. Fausett BV, et al. J Neurosci. 2008 Jan 30;28(5):1109-17. doi: 10.1523/JNEUROSCI.4853-07.2008. J Neurosci. 2008. PMID: 18234889 Free PMC article. - Characterization of Müller glia and neuronal progenitors during adult zebrafish retinal regeneration.
Thummel R, Kassen SC, Enright JM, Nelson CM, Montgomery JE, Hyde DR. Thummel R, et al. Exp Eye Res. 2008 Nov;87(5):433-44. doi: 10.1016/j.exer.2008.07.009. Epub 2008 Aug 5. Exp Eye Res. 2008. PMID: 18718467 Free PMC article. - Retina regeneration in zebrafish.
Wan J, Goldman D. Wan J, et al. Curr Opin Genet Dev. 2016 Oct;40:41-47. doi: 10.1016/j.gde.2016.05.009. Epub 2016 Jun 6. Curr Opin Genet Dev. 2016. PMID: 27281280 Free PMC article. Review. - Müller glia: Stem cells for generation and regeneration of retinal neurons in teleost fish.
Lenkowski JR, Raymond PA. Lenkowski JR, et al. Prog Retin Eye Res. 2014 May;40:94-123. doi: 10.1016/j.preteyeres.2013.12.007. Epub 2014 Jan 8. Prog Retin Eye Res. 2014. PMID: 24412518 Free PMC article. Review.
Cited by
- Hallmarks of regeneration.
Poss KD, Tanaka EM. Poss KD, et al. Cell Stem Cell. 2024 Sep 5;31(9):1244-1261. doi: 10.1016/j.stem.2024.07.007. Epub 2024 Aug 19. Cell Stem Cell. 2024. PMID: 39163854 Review. - Inflammation is a critical factor for successful regeneration of the adult zebrafish retina in response to diffuse light lesion.
Bludau O, Weber A, Bosak V, Kuscha V, Dietrich K, Hans S, Brand M. Bludau O, et al. Front Cell Dev Biol. 2024 Jul 12;12:1332347. doi: 10.3389/fcell.2024.1332347. eCollection 2024. Front Cell Dev Biol. 2024. PMID: 39071801 Free PMC article. - Mycb and Mych stimulate Müller glial cell reprogramming and proliferation in the uninjured and injured zebrafish retina.
Lee MS, Jui J, Sahu A, Goldman D. Lee MS, et al. Development. 2024 Jul 15;151(14):dev203062. doi: 10.1242/dev.203062. Epub 2024 Jul 26. Development. 2024. PMID: 38984586 Free PMC article. - Retina regeneration: lessons from vertebrates.
Sharma P, Ramachandran R. Sharma P, et al. Oxf Open Neurosci. 2022 Aug 2;1:kvac012. doi: 10.1093/oons/kvac012. eCollection 2022. Oxf Open Neurosci. 2022. PMID: 38596712 Free PMC article. Review. - ID factors regulate the ability of Müller glia to become proliferating neurogenic progenitor-like cells.
Taylor OB, Patel SP, Hawthorn EC, El-Hodiri HM, Fischer AJ. Taylor OB, et al. Glia. 2024 Jul;72(7):1236-1258. doi: 10.1002/glia.24523. Epub 2024 Mar 21. Glia. 2024. PMID: 38515287
References
- Barthel LK, Raymond PA (2000). In situ hybridization studies of retinal neurons. Methods Enzymol 316:579–590. - PubMed
- Bormann P, Zumsteg VM, Roth LW, Reinhard E (1998). Target contact regulates GAP-43 and alpha-tubulin mRNA levels in regenerating retinal ganglion cells. J Neurosci Res 52:405–419. - PubMed
- Braisted JE, Raymond PA (1992). Regeneration of dopaminergic neurons in goldfish retina. Development 114:913–919. - PubMed
- Braisted JE, Essman TF, Raymond PA (1994). Selective regeneration of photoreceptors in goldfish retina. Development 120:2409–2419. - PubMed
- Bringmann A, Reichenbach A (2001). Role of müller cells in retinal degenerations. Front Biosci 6:E72–E92. - PubMed
Publication types
MeSH terms
Substances
LinkOut - more resources
Full Text Sources
Molecular Biology Databases


