Rabphilin regulates SNARE-dependent re-priming of synaptic vesicles for fusion - PubMed (original) (raw)
Rabphilin regulates SNARE-dependent re-priming of synaptic vesicles for fusion
Ferenc Deák et al. EMBO J. 2006.
Abstract
Synaptic vesicle fusion is catalyzed by assembly of synaptic SNARE complexes, and is regulated by the synaptic vesicle GTP-binding protein Rab3 that binds to RIM and to rabphilin. RIM is a known physiological regulator of fusion, but the role of rabphilin remains obscure. We now show that rabphilin regulates recovery of synaptic vesicles from use-dependent depression, probably by a direct interaction with the SNARE protein SNAP-25. Deletion of rabphilin dramatically accelerates recovery of depressed synaptic responses; this phenotype is rescued by viral expression of wild-type rabphilin, but not of mutant rabphilin lacking the second rabphilin C2 domain that binds to SNAP-25. Moreover, deletion of rabphilin also increases the size of synaptic responses in synapses lacking the vesicular SNARE protein synaptobrevin in which synaptic responses are severely depressed. Our data suggest that binding of rabphilin to SNAP-25 regulates exocytosis of synaptic vesicles after the readily releasable pool has either been physiologically exhausted by use-dependent depression, or has been artificially depleted by deletion of synaptobrevin.
Figures
Figure 1
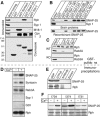
Binding of rabphilin to SNAP-25. (A) Pulldowns of rat brain proteins with immobilized GST, GST-syntaxin, GST-SNAP-25, and GST-synaptobrevin (in 50 mM HEPES pH 7.2, 0.1 M NaCl, 4 mM EGTA, 2 mM MgCl2, 1 mM DTT, protease inhibitor cocktail (Roche), and 0.5% Triton X-100). Bound proteins were analyzed by immunoblotting (top panels) for rabphilin (Rph), synaptophysin 1 (Syp 1), Munc18-1 (M18-1) and complexin 1 and 2 (Cpx 1 & 2). Bottom panel shows a Coomassie-blue stained gel of the GST-proteins to illustrate that similar amounts of protein were employed. (B) Pulldowns of rat brain proteins (upper panel) or recombinant SNAP-25 (lower panel) with immobilized GST-fusion proteins containing full-length rabphilin (GST-FL Rph) or rabphilin fragments (GST-Rph1-181 or -Rph1-361=residues 1–181 or 1–361 of rabphilin; GST-Rph C2A, C2B, or C2AB=C2A-, C2B-, or double C2A/B-domain fragment of rabphilin; GST=GST only control). Bound proteins were analyzed by immunoblotting for SNAP-25 and for synaptophysin 1 (Syp 1; used as a negative control). (C) Effects of divalent cations on the interaction of rabphilin with SNAP-25. Solubilized synaptic vesicle proteins from wild type (WT) and rabphilin KO mice (KO) were bound to GST-SNAP-25 in the presence of 1 mM of the indicated divalent cations; bound proteins were analyzed by immunoblotting. (D) Immunoprecipitations of rabphilin from detergent-solubilized synaptosomes with a polyclonal antibody to the N-terminus of rabphilin (I734) in the presence or absence of 1 mM Ca2+. Bound proteins were analyzed by immunoblotting with monoclonal antibodies to SNAP-25, syntaxin 1, Rab3A, synaptophysin 1 (Syp 1), GDI, or rabphilin (Rph). (E, F) Analysis of SNAP-25 co-immunoprecipitations with rabphilin as a function of GDP versus GTPγS (E; antibody=‘antibody only' control, extract=control with the detergent-solubilized synaptosome extract and protein G-Sepharose only), or as a function of independent rabphilin antibodies (I734 and I374=antibodies to the rabphilin N-terminal half; I731=antibody to the rabphilin C-terminal half) in the presence or absence of Ca2+ (F). In (E) and (F), the smear below the rabphilin band is caused by the IgG from the immunoprecipitations.
Figure 2
Characterization of the rabphilin C2B domain binding to SNAP-25 by NMR spectroscopy. (A, B) 1H-15N HSQC spectra of the 15N-labeled C2B domain from rabphilin (75 μM) in the absence (black) or presence (red) of unlabeled SNAP-25 (75 μM). Spectra were acquired in 0.2 mM EDTA (A) or 10 mM Ca2+ (B). To facilitate comparison, a few cross-peaks that do not change with SNAP-25 are identified (underlined if the peaks are not altered by Ca2+, and not underlined if they shift with Ca2+). The subset of peaks that move after addition of SNAP-25 are marked by arrowheads; these peaks exhibit analogous changes in the presence and absence of Ca2+. (C, D) Expansions of the 1H-15N HSQC spectra from the rabphilin C2B domain (75 μM) recorded in 10 mM Ca2+ without SNAP-25 (black) or with 150 μM SNAP-25 (red). Note that some peaks shift substantially with SNAP-25 while others do not. Residue assignments are indicated for some of the cross-peaks.
Figure 3
Ribbon diagram of the C2B domain of rabphilin: identification of the SNAP-25 binding site defined by chemical shift changes. The figure displays views of the rabphilin C2B domain with a 90° rotation around the vertical axis. The Ca2+-binding loops are shown on top with two Ca2+ ions bound (orange; Ubach et al, 1999). β-Strands are displayed in yellow. Residues that changed upon SNAP-25 binding are shown in red. Note that these changes are restricted to the bottom α-helix and the adjacent bottom loop. N- and C-termini are indicated by white ‘N' and ‘C'.
Figure 4
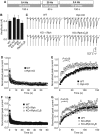
Effect of the deletion of rabphilin on the recovery of synaptic responses from use-dependent depression. (A) Experimental design. Cultured neurons from wild type or rabphilin KO mice were either analyzed without further manipulations (WT and Rph KO), or rabphilin-deficient neurons were infected with lentivirus expressing full-length rabphilin (iRph) or rabphilin lacking the C2B domain (iRΔC2B). Neurons were stimulated at 0.4 Hz for 150 s to determine the initial EPSC amplitude, then at 20 Hz for 60 s to cause use-dependent depression, and finally again at 0.4 Hz for 150 s to monitor recovery of synaptic responses. (B) Bar graph of initial EPSC amplitudes. (C) Representative traces during synaptic recovery (only the first 100 ms of the first 12 pulses are shown for clarity). (D, E) Depression of synaptic responses in WT and rabphilin KO neurons during 20 Hz stimulation (D; peak currents were normalized to the first response), and recovery of synaptic responses from synaptic depression during 0.4 Hz stimulation (E; normalized to the average amplitude of each cell during the initial 0.4 Hz stimulation). Rabphilin-deficient synapses recovered significantly faster up to the 21st pulse (P<0.05). (F, G) Depression of synaptic responses during 20 Hz stimulation in WT neurons and in rabphilin KO neurons expressing full-length iRph or C-terminally truncated iRph (iRΔC2B) (F), and subsequent recovery of synaptic responses in these neurons (G). For (B) and (D–G), data shown are means±s.e.m. (number of neurons analyzed in four independent cultures: WT, _n_=14; Rph KO, _n_=11; iRph, _n_=12; iRphΔC2B, _n_=13).
Figure 5
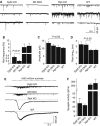
Spontaneous synaptic responses (‘minis') and hypertonic sucrose-evoked synaptic responses in cultured hippocampal neurons. (A) Representative traces of spontaneous synaptic events monitored in 1 μM tetrodotoxin in neurons from wild type (WT), synaptobrevin KO (Syb2 KO), rabphilin KO (Rph KO), and synaptobrevin/rabphilin double KO mice (SR DKO). (B) Frequency of spontaneous synaptic events. Only the statistically significant difference between synaptobrevin-deficient and synaptobrevin/rabphilin-double deficient synapses is marked. (C) Amplitudes of spontaneous synaptic events. Synaptobrevin-deficient neurons exhibit larger amplitudes than synaptobrevin-containing neurons, but this difference is statistically significant only for the indicated comparison. (D) Rise times (measured as time required for reaching the half-maximum) of spontaneous synaptic events. Double KO neurons (SR DKO) exhibit significantly slower rise times than rabphilin single KO neurons. In (B–D), all data shown are means±s.e.m. (_n_=19 SR DKO; 10 Syb2 KO; 8 WT; 8 Rph KO). (E) Representative traces of synaptic responses evoked with hypertonic sucrose (0.5 Osm). (F) Summary graph of synaptic responses to sucrose monitored in WT and various single- and double-KO neurons. Responses are calculated as the cumulative charge transfer integrated over a 2 s interval at the peak of the response (means±s.e.m.; _n_=16 for SR DKO, _n_=12 for rph KO, _n_=6 for syb2 KO and _n_=4 for WT).
Figure 6
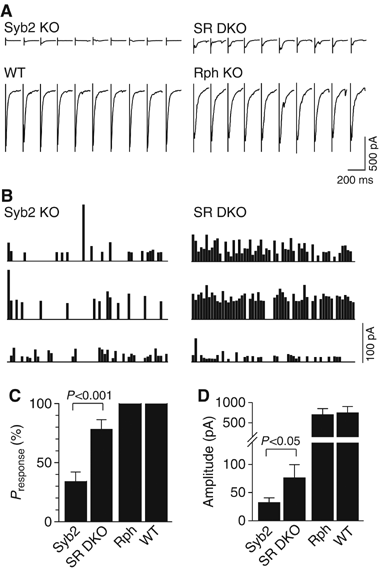
Synaptic responses to 1 Hz stimulation. (A) Representative traces from whole-cell recordings during 1 Hz field stimulations. Only the first 200 ms of each response is shown for clarity. (B) Diary plots of responses recorded from synaptobrevin KO neurons (Syb2 KO) and double synaptobrevin/ rabphilin KO neurons (SR DKO). (C) Fraction of successful stimuli during 60 pulses at 1 Hz. (D) Amplitudes of evoked responses. Data in (C, D) are means±s.e.m. (_n_=11 Syb2 KO cells; 7 SR DKO cells; 7 Rph KO cells; 4 WT cells).
Figure 7
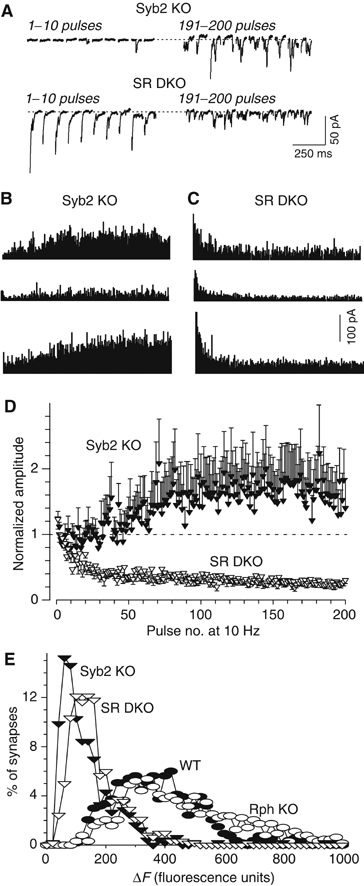
Synaptic responses to 10 Hz stimulation. (A) Representative traces from whole-cell recordings obtained during 10 Hz stimulations of synaptobrevin KO neurons (Syb2 KO) and synaptobrevin/rabphilin double KO neurons (SR DKO). Responses to pulse # 1–10 and 191–200 are shown. (B, C) Diary plots of synaptic responses in three cells from synaptobrevin KO mice and synaptobrevin/rabphilin double KO mice during 10 Hz stimulation. (D) Normalized amplitudes of synaptic responses during 10 Hz stimulation from synaptobrevin KO neurons (Syb2 KO; _n_=9) and synaptobrevin/rabphilin double KO neurons (SR DKO; _n_=9). Synaptic responses were normalized to the average of the first five pulses in the train, and are shown as means±s.e.m. Only the difference between the synaptobrevin KO neurons and the three other genotypes is statistically significant (P<0.05). (E) Size of the recycling pools of synaptic vesicles measured by FM2-10 staining and destaining. FM2-10-loaded synaptic boutons were destained with 5 × 90 mM KCl/2 mM CaCl2 (_n_=12 (610 synapses) for SR DKO, _n_=10 (632 synapses) for Rph KO, _n_=10 (486 synapses) for syb2 KO, and _n_=9 (533 synapses) for WT in four independent cultures). Data shown are histograms of the distribution of fluorescent loss (in arbitrary units); the difference between synaptobrevin-deficient synapses containing or lacking rabphilin is statistically significant (P<0.01).
Similar articles
- The C2B domain of rabphilin directly interacts with SNAP-25 and regulates the docking step of dense core vesicle exocytosis in PC12 cells.
Tsuboi T, Fukuda M. Tsuboi T, et al. J Biol Chem. 2005 Nov 25;280(47):39253-9. doi: 10.1074/jbc.M507173200. Epub 2005 Oct 3. J Biol Chem. 2005. PMID: 16203731 - Rabphilin 3A binds the N-peptide of SNAP-25 to promote SNARE complex assembly in exocytosis.
Li T, Cheng Q, Wang S, Ma C. Li T, et al. Elife. 2022 Sep 29;11:e79926. doi: 10.7554/eLife.79926. Elife. 2022. PMID: 36173100 Free PMC article. - Rabphilin knock-out mice reveal that rabphilin is not required for rab3 function in regulating neurotransmitter release.
Schlüter OM, Schnell E, Verhage M, Tzonopoulos T, Nicoll RA, Janz R, Malenka RC, Geppert M, Südhof TC. Schlüter OM, et al. J Neurosci. 1999 Jul 15;19(14):5834-46. doi: 10.1523/JNEUROSCI.19-14-05834.1999. J Neurosci. 1999. PMID: 10407024 Free PMC article. - SNARE complexes prepare for membrane fusion.
Sørensen JB. Sørensen JB. Trends Neurosci. 2005 Sep;28(9):453-5. doi: 10.1016/j.tins.2005.06.007. Trends Neurosci. 2005. PMID: 15996765 Review. - Physical link and functional coupling of presynaptic calcium channels and the synaptic vesicle docking/fusion machinery.
Sheng ZH, Westenbroek RE, Catterall WA. Sheng ZH, et al. J Bioenerg Biomembr. 1998 Aug;30(4):335-45. doi: 10.1023/a:1021985521748. J Bioenerg Biomembr. 1998. PMID: 9758330 Review.
Cited by
- Short-term presynaptic plasticity.
Regehr WG. Regehr WG. Cold Spring Harb Perspect Biol. 2012 Jul 1;4(7):a005702. doi: 10.1101/cshperspect.a005702. Cold Spring Harb Perspect Biol. 2012. PMID: 22751149 Free PMC article. Review. - Rabphilin3A reduces integrin-dependent growth cone signaling to restrict axon regeneration after trauma.
Sekine Y, Kannan R, Wang X, Strittmatter SM. Sekine Y, et al. Exp Neurol. 2022 Jul;353:114070. doi: 10.1016/j.expneurol.2022.114070. Epub 2022 Apr 7. Exp Neurol. 2022. PMID: 35398339 Free PMC article. - Synaptic vesicle mobility in mouse motor nerve terminals with and without synapsin.
Gaffield MA, Betz WJ. Gaffield MA, et al. J Neurosci. 2007 Dec 12;27(50):13691-700. doi: 10.1523/JNEUROSCI.3910-07.2007. J Neurosci. 2007. PMID: 18077680 Free PMC article. - The PIP2 binding mode of the C2 domains of rabphilin-3A.
Montaville P, Coudevylle N, Radhakrishnan A, Leonov A, Zweckstetter M, Becker S. Montaville P, et al. Protein Sci. 2008 Jun;17(6):1025-34. doi: 10.1110/ps.073326608. Epub 2008 Apr 23. Protein Sci. 2008. PMID: 18434502 Free PMC article. - Doc2 supports spontaneous synaptic transmission by a Ca(2+)-independent mechanism.
Pang ZP, Bacaj T, Yang X, Zhou P, Xu W, Südhof TC. Pang ZP, et al. Neuron. 2011 Apr 28;70(2):244-51. doi: 10.1016/j.neuron.2011.03.011. Neuron. 2011. PMID: 21521611 Free PMC article.
References
- Castillo PE, Janz R, Tzounopoulos T, Südhof TC, Malenka RC, Nicoll RA (1997) The synaptic vesicle protein Rab3A is essential for mossy fiber long term potentiation in the hippocampus. Nature 388: 590–593 - PubMed
- Castillo PE, Schoch S, Schmitz F, Südhof TC, Malenka RC (2002) RIM1α is required for presynaptic long-term potentiation. Nature 415: 327–330 - PubMed
- Chung SH, Song WJ, Kim K, Bednarski JJ, Chen J, Prestwich GD, Holz RW (1998) The C2 domains of Rabphilin3A specifically bind phosphatidylinositol 4,5-bisphosphate containing vesicles in a Ca2+-dependent manner. In vitro characteristics and possible significance. J Biol Chem 273: 10240–10248 - PubMed
- Chung SH, Takai Y, Holz RW (1995) Evidence that the Rab3a-binding protein, rabphilin3a, enhances regulated secretion. Studies in adrenal chromaffin cells. J Biol Chem 270: 16714–16718 - PubMed
Publication types
MeSH terms
Substances
LinkOut - more resources
Full Text Sources
Other Literature Sources
Molecular Biology Databases
Miscellaneous
