Induction of intrahepatic cholangiocellular carcinoma by liver-specific disruption of Smad4 and Pten in mice - PubMed (original) (raw)
. 2006 Jul;116(7):1843-52.
doi: 10.1172/JCI27282. Epub 2006 Jun 8.
Shogo Kobayashi, Wenhui Qiao, Cuiling Li, Cuiying Xiao, Svetlana Radaeva, Bangyan Stiles, Rui-Hong Wang, Nobuya Ohara, Tadashi Yoshino, Derek LeRoith, Michael S Torbenson, Gregory J Gores, Hong Wu, Bin Gao, Chu-Xia Deng
Affiliations
- PMID: 16767220
- PMCID: PMC1474816
- DOI: 10.1172/JCI27282
Induction of intrahepatic cholangiocellular carcinoma by liver-specific disruption of Smad4 and Pten in mice
Xiaoling Xu et al. J Clin Invest. 2006 Jul.
Abstract
Cholangiocellular carcinoma (CC), the second most common primary liver cancer, is associated with a poor prognosis. It has been shown that CCs harbor alterations of a number of tumor-suppressor genes and oncogenes, yet key regulators for tumorigenesis remain unknown. Here we have generated a mouse model that develops CC with high penetrance using liver-specific targeted disruption of tumor suppressors SMAD4 and PTEN. In the absence of SMAD4 and PTEN, hyperplastic foci emerge exclusively from bile ducts of mutant mice at 2 months of age and continue to grow, leading to tumor formation in all animals at 4-7 months of age. We show that CC formation follows a multistep progression of histopathological changes that are associated with significant alterations, including increased levels of phosphorylated AKT, FOXO1, GSK-3beta, mTOR, and ERK and increased nuclear levels of cyclin D1. We further demonstrate that SMAD4 and PTEN regulate each other through a novel feedback mechanism to maintain an expression balance and synergistically repress CC formation. Finally, our analysis of human CC detected PTEN inactivation in a majority of p-AKT-positive CCs, while about half also lost SMAD4 expression. These findings elucidate the relationship between SMAD4 and PTEN and extend our understanding of CC formation.
Figures
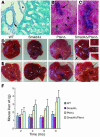
Figure 1. Targeted disruption of Smad4 and Pten results in liver cancer.
(A–C) Alb-Cre activity assayed using Rosa-26 reporter mice at P30 (A) and P15 (B and C). Arrows indicate bile ducts, arrowheads indicate hepatocytes, and the asterisk marks an artery, which is not stained. The bile duct (arrow in B) is amplified in C. Magnification: ×300 (A), ×450 (B), ×900 (C). (D and E) Tumor formation in 4-month- (D) and 8-month-old (E) Smad4Co/CoPtenCo/CoAlb-Cre mice, but not in mice of other genotypes. (F) Weights of livers isolated from mice at different ages as indicated. PtenΔ, PtenCo/CoAlb-Cre mice_;_ Smad4Δ, Smad4Co/CoAlb-Cre mice_;_ Smad4Δ/PtenΔ, Smad4Co/CoPtenCo/CoAlb-Cre mice.
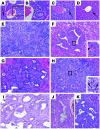
Figure 2. CC formation in Smad4Co/Co PtenCo/Co Alb-Cre mice.
(A–D) Histologic analysis of livers isolated from 2-month-old Smad4Co/CoPtenCo/CoAlb-Cre (A and B), WT (C), and Smad4Co/CoAlb-Cre (D) mice. Arrows indicate bile ducts. (E) An H&E-stained liver section showing significantly increased bile duct branching in the liver of a 3-month-old Smad4Co/CoPtenCo/CoAlb-Cre mouse. The arrow and arrowhead indicate large and small branches, respectively. (F–I) Bile duct dysplasia (F), CC foci with varying histopathology (G and H), and well-developed CC (I) found in Smad4Co/CoPtenCo/CoAlb-Cre livers. Arrowheads in the insets indicate cells at the mitotic phase. (J and K) Bile duct hyperplasia (J) and CC foci in PtenCo/CoAlb-Cre (K) livers. Magnification: ×100 (A); ×200 (B–D and H); ×400 (E–G and I–K).
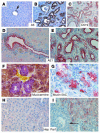
Figure 3. Tumors developed from Smad4Co/Co PtenCo/Co Alb-Cre mice are exclusively of bile duct origin.
Molecular markers used are as indicated. (A and H) Livers from WT mice. (B–G and I) Livers from Smad4Co/CoPtenCo/CoAlb-Cre mice. The arrow in I indicates tumor cells that were Hep Par1 negative. At least 5 samples were used for each antibody. Magnification: ×300 (A–C); ×600 (D–G); ×500 (H and I).
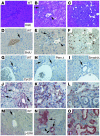
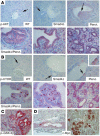
Figure 4. Molecular characterization of CCs that developed in_Smad4Co/CoPtenCo/CoAlb-Cre_ mice.
H&E (A–C) and BrdU (D–F) images. Liver cells appeared normal in WT liver (A and D), and hyperplasic foci (B and E) and bigger tumors (C and F) developed in Smad4Co/CoPtenCo/CoAlb-Cre mice. The arrow in E indicates an area of BrdU-positive cells, and the arrowhead indicates a single BrdU-positive cell in a bile duct with moderately increased numbers of cells. Their corresponding positions are indicated in B. (G–O) Immunohistochemical staining with antibodies against cyclin D1 (CtcD1) (G–L) and p-ERK (M–O) of control liver, neoplastic foci, and bigger tumors. Arrows in J point to cyclin D1–positive bile ducts that still maintained single layers of cells. Arrowheads in N indicate p-ERK–negative cells in the single layer area of the bile duct. These cells gradually became p-ERK positive, especially when multiple layers of cells accumulated in the bile duct (arrows). Most samples were from 4-month-old mice, except for some bigger tumors (K, L, and O), which were from 8-month-old mutant mice. At least 5 samples of each genotype were used for each antibody. Unless otherwise indicated (in the upper-right corner), tumors from Smad4Co/CoPtenCo/CoAlb-Cre mice are shown. Magnification: ×500.
Figure 5. Activation of AKT/mTOR pathways in CCs that developed in Smad4Co/CoPtenCo/CoAlb-Cre mice.
(A) Levels of p-AKT. Genotypes are as indicted. (B) Phosphorylated mTOR (p-mTOR).The lower panels in A and B represent samples from Smad4Co/CoPtenCo/CoAlb-Cre mice. (C) Phosphorylated GSK-3β (p–GSK-3β). (D) c-Myc. Arrows in A and B indicate bile ducts. Note that the bile ducts in PtenCo/CoAlb-Cre livers were hyperplastic and abnormally enlarged. Some bile duct cells also displayed increased expression of p-AKT and p-mTOR (arrows). This phenotype was not found in WT and Smad4Co/CoAlb-Cre samples. At least 5 samples of each genotype were used for each antibody. Magnification: ×500.
Figure 6. Analysis of cultured cells derived from liver cancers and normal livers of control mice.
(A) Transfection of Smad4 and Pten expression vectors separately or together into 858 cells. Ten micrograms of total DNA were used for each transfection in each 10-cm dish in various combinations: i.e., pcDNA vector alone, vector plus Smad4 or Pten, or Smad4 plus Pten of 5 μg each. Multiple loading controls were performed, but only 1 is shown. (B and C) Western blot analyses of SMAD4 (B) and PTEN (C) using lysates isolated from livers of various genotypes, as indicated. (D) Ectopic overexpression of Smad4 or Pten in 644 and Hepa1–6 cells decreased expression of each other. In all the above experiment, samples were harvested 48 hours after transfection. (E) Acute suppression of Smad4 or Pten in Hepa1–6 cells. Cell lysates were prepared 30 hours after transfection and subjected to Western blot analysis. Con, control.
Figure 7. SMAD4 and PTEN negatively regulate each other.
(A and B) Real-time PCR analysis of Smad4 (A) and Pten (B) transcription levels in 644 cells transfected with Smad4. Levels of gene expression are either expressed as fold change as compared with endogenous Smad4, which was set as 1 (A), or as percentage of untransfected Pten, which was set as 100% (B). The data shown were averaged from 3 independent transfections. (C) SMAD4 protein (left) and transcription (right) levels of 644 cells that were transfected with Smad4. (D) SMAD4 protein levels in SMAD4/PTEN double mutant (i.e., 858) cells that were transfected with Smad4. Forty-eight hours after transfection, cells were treated with cycloheximide, 100 μg/ml) or mock treated for an additional 6, 9, and 24 hours as indicated. (E and F) SMAD4 and PTEN levels in 858 cells that were transfected with Smad4 and Pten (E) or Smad4 plus vector (F). Forty-eight hours after transfection, cells were treated with cycloheximide for 6, 9, and 24 hours before being subjected to Western blot analysis. (G) SMAD4 and p-AKT levels in 858 cells that were transfected with Smad4. Forty-eight hours after transfection, cells were treated with LY294002 at 10 μM for 9 and 24 hours before being subjected to Western blot analysis. (H) Expression of the activated form of AKT* which carries changes in T308A/S473A (49), in Hepa1–6 cells increased SMAD4 protein levels (right lane) compared with WT AKT-transfected cells (left lane). NT, nontransfected cells; Un, untreated cells.
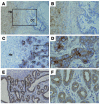
Figure 8. Immunohistochemistry for SMAD4, p-PTEN, and p-FOXO1.
Representative images of SMAD4 immunostaining (×100 [A], ×200 [B]), p-PTEN (×200 [C], ×600 [D]), and p-FOXO (×200 [E], ×600 [F]). He, hepatocytes.
Similar articles
- Synergistic action of Smad4 and Pten in suppressing pancreatic ductal adenocarcinoma formation in mice.
Xu X, Ehdaie B, Ohara N, Yoshino T, Deng CX. Xu X, et al. Oncogene. 2010 Feb 4;29(5):674-86. doi: 10.1038/onc.2009.375. Epub 2009 Nov 9. Oncogene. 2010. PMID: 19901970 - Ars2 is overexpressed in human cholangiocarcinomas and its depletion increases PTEN and PDCD4 by decreasing microRNA-21.
He Q, Cai L, Shuai L, Li D, Wang C, Liu Y, Li X, Li Z, Wang S. He Q, et al. Mol Carcinog. 2013 Apr;52(4):286-96. doi: 10.1002/mc.21859. Epub 2011 Dec 28. Mol Carcinog. 2013. PMID: 22213145 - Synergistic function of Smad4 and PTEN in suppressing forestomach squamous cell carcinoma in the mouse.
Teng Y, Sun AN, Pan XC, Yang G, Yang LL, Wang MR, Yang X. Teng Y, et al. Cancer Res. 2006 Jul 15;66(14):6972-81. doi: 10.1158/0008-5472.CAN-06-0507. Cancer Res. 2006. PMID: 16849541 - Genetics of hepatobiliary carcinogenesis.
Nault JC, Zucman-Rossi J. Nault JC, et al. Semin Liver Dis. 2011 May;31(2):173-87. doi: 10.1055/s-0031-1276646. Epub 2011 May 2. Semin Liver Dis. 2011. PMID: 21538283 Review. - Pathogenesis of cholangiocarcinoma: From genetics to signalling pathways.
Kongpetch S, Jusakul A, Ong CK, Lim WK, Rozen SG, Tan P, Teh BT. Kongpetch S, et al. Best Pract Res Clin Gastroenterol. 2015 Apr;29(2):233-44. doi: 10.1016/j.bpg.2015.02.002. Epub 2015 Feb 17. Best Pract Res Clin Gastroenterol. 2015. PMID: 25966424 Review.
Cited by
- Albumin promoter-driven FlpO expression induces efficient genetic recombination in mouse liver.
Zhu X, Yang Y, Feng D, Wang O, Chen J, Wang J, Wang B, Liu Y, Edenfield BH, Haddock AN, Wang Y, Patel T, Bi Y, Ji B. Zhu X, et al. Am J Physiol Gastrointest Liver Physiol. 2024 May 1;326(5):G495-G503. doi: 10.1152/ajpgi.00263.2023. Epub 2024 Mar 12. Am J Physiol Gastrointest Liver Physiol. 2024. PMID: 38469630 - PTEN deficiency induces an extrahepatic cholangitis-cholangiocarcinoma continuum via aurora kinase A in mice.
Yang Y, Wang J, Wan J, Cheng Q, Cheng Z, Zhou X, Wang O, Shi K, Wang L, Wang B, Zhu X, Chen J, Feng D, Liu Y, Jahan-Mihan Y, Haddock AN, Edenfield BH, Peng G, Hohenstein JD, McCabe CE, O'Brien DR, Wang C, Ilyas SI, Jiang L, Torbenson MS, Wang H, Nakhleh RE, Shi X, Wang Y, Bi Y, Gores GJ, Patel T, Ji B. Yang Y, et al. J Hepatol. 2024 Jul;81(1):120-134. doi: 10.1016/j.jhep.2024.02.018. Epub 2024 Feb 28. J Hepatol. 2024. PMID: 38428643 - Smad4 restricts injury-provoked biliary proliferation and carcinogenesis.
Alexander WB, Wang W, Hill MA, O'Dell MR, Ruffolo LI, Guo B, Jackson KM, Ullman N, Friedland SC, McCall MN, Patel A, Figueroa-Guilliani N, Georger M, Belt BA, Whitney-Miller CL, Linehan DC, Murphy PJ, Hezel AF. Alexander WB, et al. Dis Model Mech. 2024 Jun 1;17(6):dmm050358. doi: 10.1242/dmm.050358. Epub 2024 Feb 28. Dis Model Mech. 2024. PMID: 38415925 Free PMC article. - The heterogeneity of signaling pathways and drug responses in intrahepatic cholangiocarcinoma with distinct genetic mutations.
Feng Y, Zhao M, Wang L, Li L, Lei JH, Zhou J, Chen J, Wu Y, Miao K, Deng CX. Feng Y, et al. Cell Death Dis. 2024 Jan 11;15(1):34. doi: 10.1038/s41419-023-06406-7. Cell Death Dis. 2024. PMID: 38212325 Free PMC article. - New and Old Key Players in Liver Cancer.
Cuesta ÁM, Palao N, Bragado P, Gutierrez-Uzquiza A, Herrera B, Sánchez A, Porras A. Cuesta ÁM, et al. Int J Mol Sci. 2023 Dec 5;24(24):17152. doi: 10.3390/ijms242417152. Int J Mol Sci. 2023. PMID: 38138981 Free PMC article. Review.
References
- Okuda K., Nakanuma Y., Miyazaki M.2002. . Cholangiocarcinoma: recent progress. Part 2: molecular pathology and treatment. J. Gastroenterol. Hepatol. 171056–1063. - PubMed
- Olnes M.J., Erlich R. A review and update on cholangiocarcinoma. Oncology. 2004;66:167–179. - PubMed
- Sirica A.E. Cholangiocarcinoma: molecular targeting strategies for chemoprevention and therapy. Hepatology. 2005;41:5–15. - PubMed
- Kang Y.K., Kim W.H., Jang J.J. Expression of G1-S modulators (p53, p16, p27, cyclin D1, Rb) and Smad4/Dpc4 in intrahepatic cholangiocarcinoma. Hum. Pathol. 2002;33:877–883. - PubMed
Publication types
MeSH terms
Substances
LinkOut - more resources
Full Text Sources
Other Literature Sources
Medical
Molecular Biology Databases
Research Materials
Miscellaneous
