Flexible phenylalanine-glycine nucleoporins as entropic barriers to nucleocytoplasmic transport - PubMed (original) (raw)
Flexible phenylalanine-glycine nucleoporins as entropic barriers to nucleocytoplasmic transport
Roderick Y H Lim et al. Proc Natl Acad Sci U S A. 2006.
Abstract
Natively unfolded phenylalanine-glycine (FG)-repeat domains are alleged to form the physical constituents of the selective barrier-gate in nuclear pore complexes during nucleocytoplasmic transport. Presently, the biophysical mechanism behind the selective gate remains speculative because of a lack of information regarding the nanomechanical properties of the FG domains. In this work, we have applied the atomic force microscope to measure the mechanical response of individual and clusters of FG molecules. Single-molecule force spectroscopy reveals that FG molecules are unfolded and highly flexible. To provide insight into the selective gating mechanism, an experimental platform has been constructed to study the collective behavior of surface-tethered FG molecules at the nanoscale. Measurements indicate that the collective behavior of such FG molecules gives rise to an exponentially decaying long-range steric repulsive force. This finding indicates that the molecules are thermally mobile in an extended polymer brush-like conformation. This assertion is confirmed by observing that the brush-like conformation undergoes a reversible collapse transition in less polar solvent conditions. These findings reveal how FG-repeat domains may simultaneously function as an entropic barrier and a selective trap in the near-field interaction zone of nuclear pore complexes; i.e., selective gate.
Conflict of interest statement
Conflict of interest statement: No conflicts declared.
Figures
Fig. 1.
An ensemble of 40 normalized SMFS curves can be superimposed to form a “master curve” which verifies that the elasticity of each cNup153 molecule scales with its contour length [i.e., F(x) ∝ x/_L_C]. (Inset) WLC analysis (red) of cNup153. The extension length x and unbinding force _F_un are denoted. The values of (x, _F_un, _l_p, _L_C) for each of the four representative extension curves are as follows: triangles, 65.9 nm, 203.9 pN, 0.49 nm, and 73.8 nm; circles, 115.3 nm, 202.1 pN, 0.42 nm, and 128.3 nm; diamonds, 164.7 nm, 457.3 pN, 0.34 nm, and 179.0 nm; squares, 204.1 nm, 373.9 pN, 0.28 nm, and 227.6 nm.
Fig. 2.
Characterization of the Au nanodots. (A) The design consists of a 20 × 20 nanofabricated square array of Au nanodots on a Si substrate, each separated by a distance of ≈1 μm. (Scale bar, 3 μm.) (B) Au nanodots viewed by scanning electron microscopy. (Scale bar, 1 μm.) (C) Three-dimensional AFM image of an individual Au nanodot measuring h = 27 nm and d = 93 nm. A schematic illustrates the general physical dimensions of the NPC. Blue and black boxes represent the cytoplasmic ring and nuclear ring moiety of the NPC, respectively.
Fig. 3.
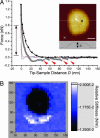
Representative force curves obtained in a 32 × 32 FV map of a cNup153-tethered nanodot. (A) A long-range, repulsive force (black line with squares) originates at D ∼ 40 nm above the nanodot. Hysteretic behavior results during tip retraction (dark gray squares) after which four stretching–unbinding responses are observed at 47, 60, 86, and 98 nm (red arrows). The average unbinding force is ≈100 pN. The force in the surrounding area does not reflect any of such characteristics on approach (red line) or retraction (blue line). The position of each force curve (square, above the nanodot; cross, in the surrounding area) is indicated in the quasi-topographic image shown in the Inset. (Scale bar, 30 nm.) The dotted line refers to the nanodot cross-section (h = 29 nm). The double-headed arrow denotes the range over which the relative stiffness was calculated. (B) Corresponding FV stiffness map showing the spatial distribution of the long-range repulsion. The relative stiffness (color-coded in the scale bar) shows that a low-stiffness region (≈0.01 N/m) is localized to the nanodot whereas the stiffness in the surrounding area is ≈0.02 N/m and corresponds to hard-wall repulsion. The values along the figure axes are in nanometers.
Fig. 4.
Semilogarithmic plot of the steric repulsion (from Fig. 3, black squares) and corresponding AdG fit (red stars). From the fit we obtain s = 23.6 nm and L = 39.0 nm. The data collected beyond D ∼ 40 nm is scattered because it is less than the minimum detectable force, which is given by the thermal noise of the cantilever: _F_min = (_k_B_T_·_k_c)1/2 ≈ 0.01 nN.
Fig. 5.
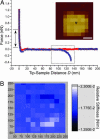
Representative force curve obtained over a nanodot in 5% 1,2-hexanediol. (A) The lack of a repulsive force on approach (red symbols) signifies that the entropic barrier has collapsed. Upon retraction (blue symbols), a cNup153 molecule remains bound to the AFM tip and unbinds at D ≈ 130 nm. A WLC fit gives _l_p = 0.5 nm for this curve (boxed). The double-headed arrow denotes the range over which the relative stiffness was calculated. The position of the force measurement (black triangle) above the nanodot is indicated in the quasitopographic image shown in the Inset. (Scale bar, 50 nm.) (B) Corresponding stiffness map showing that the relative stiffness (color-coded in the scale bar) is ≈0.02 N/m over the entire area (i.e., the entropic barrier has collapsed). The values along the figure axes are in nanometers. This stiffness map is also similar to control measurements made in the absence of cNup153 (see text).
Fig. 6.
Schematic representation of the entropic barrier. (left) The barrier is formed by the brush-like conformations of the cNup153 molecules that are tethered to the nanodot surface. The gray shaded area emphasizes the stochastic nature of the molecules over large time scales (approximately microseconds). A non-NLS cargo (blue, hatched) is repelled once it is within the near-field of the cNup153 molecules. (right) A receptor-bound cargo (blue, hatched with black dashes) is “trapped” because of attractive interactions that occur between the transport receptor and several FG sites (indicated by red dotted circles).
Similar articles
- Nanomechanical interactions of phenylalanine-glycine nucleoporins studied by single molecule force-volume spectroscopy.
Lim RY, Köser J, Huang NP, Schwarz-Herion K, Aebi U. Lim RY, et al. J Struct Biol. 2007 Aug;159(2):277-89. doi: 10.1016/j.jsb.2007.01.018. Epub 2007 Feb 16. J Struct Biol. 2007. PMID: 17446086 - Natively unfolded nucleoporins gate protein diffusion across the nuclear pore complex.
Patel SS, Belmont BJ, Sante JM, Rexach MF. Patel SS, et al. Cell. 2007 Apr 6;129(1):83-96. doi: 10.1016/j.cell.2007.01.044. Cell. 2007. PMID: 17418788 - Nanomechanical basis of selective gating by the nuclear pore complex.
Lim RY, Fahrenkrog B, Köser J, Schwarz-Herion K, Deng J, Aebi U. Lim RY, et al. Science. 2007 Oct 26;318(5850):640-3. doi: 10.1126/science.1145980. Epub 2007 Oct 4. Science. 2007. PMID: 17916694 - The Part and the Whole: functions of nucleoporins in nucleocytoplasmic transport.
Wälde S, Kehlenbach RH. Wälde S, et al. Trends Cell Biol. 2010 Aug;20(8):461-9. doi: 10.1016/j.tcb.2010.05.001. Epub 2010 Jun 4. Trends Cell Biol. 2010. PMID: 20627572 Review. - Biomechanics of the transport barrier in the nuclear pore complex.
Stanley GJ, Fassati A, Hoogenboom BW. Stanley GJ, et al. Semin Cell Dev Biol. 2017 Aug;68:42-51. doi: 10.1016/j.semcdb.2017.05.007. Epub 2017 May 12. Semin Cell Dev Biol. 2017. PMID: 28506890 Review.
Cited by
- Promiscuous binding of Karyopherinβ1 modulates FG nucleoporin barrier function and expedites NTF2 transport kinetics.
Wagner RS, Kapinos LE, Marshall NJ, Stewart M, Lim RYH. Wagner RS, et al. Biophys J. 2015 Feb 17;108(4):918-927. doi: 10.1016/j.bpj.2014.12.041. Biophys J. 2015. PMID: 25692596 Free PMC article. - Depletion of nucleoporins from HeLa nuclear pore complexes to facilitate the production of ghost pores for in vitro reconstitution.
Diguilio AL, Glavy JS. Diguilio AL, et al. Cytotechnology. 2013 Aug;65(4):469-79. doi: 10.1007/s10616-012-9501-y. Epub 2012 Oct 9. Cytotechnology. 2013. PMID: 23053785 Free PMC article. - Managing free-energy barriers in nuclear pore transport.
Nielsen B, Jeppesen C, Ipsen JH. Nielsen B, et al. J Biol Phys. 2006 Nov;32(5):465-72. doi: 10.1007/s10867-006-9029-5. Epub 2006 Dec 19. J Biol Phys. 2006. PMID: 19669451 Free PMC article. - Cargo surface hydrophobicity is sufficient to overcome the nuclear pore complex selectivity barrier.
Naim B, Zbaida D, Dagan S, Kapon R, Reich Z. Naim B, et al. EMBO J. 2009 Sep 16;28(18):2697-705. doi: 10.1038/emboj.2009.225. Epub 2009 Aug 13. EMBO J. 2009. PMID: 19680225 Free PMC article. - FG repeats facilitate integral protein trafficking to the inner nuclear membrane.
Kerr AR, Schirmer EC. Kerr AR, et al. Commun Integr Biol. 2011 Sep;4(5):557-9. doi: 10.4161/cib.4.5.16052. Epub 2011 Sep 1. Commun Integr Biol. 2011. PMID: 22046461 Free PMC article.
References
- Fahrenkrog B., Aebi U. Nat. Rev. Mol. Cell Biol. 2003;4:757–766. - PubMed
- Paine P. L., Moore L. C., Horowitz S. B. Nature. 1975;254:109–114. - PubMed
- Rexach M., Blobel G. Cell. 1995;83:683–692. - PubMed
Publication types
MeSH terms
Substances
LinkOut - more resources
Full Text Sources
Other Literature Sources


