Targeting of aberrant mRNAs to cytoplasmic processing bodies - PubMed (original) (raw)
Targeting of aberrant mRNAs to cytoplasmic processing bodies
Ujwal Sheth et al. Cell. 2006.
Abstract
In eukaryotes, a specialized pathway of mRNA degradation termed nonsense-mediated decay (NMD) functions in mRNA quality control by recognizing and degrading mRNAs with aberrant termination codons. We demonstrate that NMD in yeast targets premature termination codon (PTC)-containing mRNA to P-bodies. Upf1p is sufficient for targeting mRNAs to P-bodies, whereas Upf2p and Upf3p act, at least in part, downstream of P-body targeting to trigger decapping. The ATPase activity of Upf1p is required for NMD after the targeting of mRNAs to P-bodies. Moreover, Upf1p can target normal mRNAs to P-bodies but not promote their degradation. These observations lead us to propose a new model for NMD wherein two successive steps are used to distinguish normal and aberrant mRNAs.
Figures
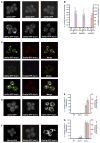
Figure 1. Upf Proteins Are Localized to P-Bodies
(A) Localization of Upf1p-GFP (left), Upf2p-GFP (middle), and Upf3p-GFP (right) in wt strain (top) and in dcp1Δ strain (bottom). (B) Histogram represents average number of P-bodies/cell (left Y axis) and average area of P-bodies/cell in pixels^2 (right Y axis) for Upf1p-GFP, Upf2p-GFP, and Upf3p-GFP. * indicates p < 0.05 for wt versus dcp1Δ strain. (C) Panel on the left (vertical) shows localization of GFP-tagged Upf proteins; middle panel (vertical) shows localization of RFP-tagged Dcp2p; and panel on the right (vertical) shows the merge generated using Adobe Photoshop. Top row shows localization of Upf1p, middle panel shows the localization of Upf2p, and bottom panel shows localization of Upf3p. (D) shows localization of Upf1p-GFP in wt strain (left), lsm1Δ strain (middle), and dcp2Δ strain (right). (E) Histogram represents average number of P-bodies/cell (left Y axis) and average area of P-bodies/cell in pixels^2 (right Y axis) for Upf1p-GFP. * indicates p < 0.005 for wt versus dcp2Δ strain. (F) Localization of Dhh1p-GFP in wt strain (left), lsm1Δ strain (middle), and dcp1Δ strain (right). (G) Histogram represents average number of P-bodies/cell (left Y axis) and average area of P-bodies/cell in pixels^2 (right Y axis) for Dhh1p-GFP. * indicates p < 0.05 for wt versus lsm1Δ and dcp1Δ strain. Data are represented as mean of three experiments ± SD.
Figure 2. Nonsense-Containing Full-Length Reporter mRNA Localizes to P-Bodies
(A) First panel from left to right: Plasmid expressing U1A-GFP alone in wt (i), upf1Δ (ii), upf2Δ (iii), and upf3Δ (iv) strains. Second panel from left to right: Wild-type PGK1 reporter mRNA with U1A binding sites and plasmid expressing U1A-GFP in wt (v), upf1Δ (vi), upf2Δ (vii), and upf3Δ (viii) strains. Third panel from left to right: PGK1 mRNA with a premature stop codon at position 22 with U1A binding sites and plasmid expressing U1A-GFP in wt (ix), upf1Δ (x), upf2Δ (xi), and upf3Δ (xii) strains. Fourth panel from left to right: PGK1 mRNA with a premature stop codon at position 225 with U1A binding sites and plasmid expressing U1A GFP in wt (xiii), upf1Δ (xiv), upf2Δ (xv), and upf3Δ (xvi) strains. All the mRNAs lack the pG tract to trap the decay intermediate. The schematic diagram of the reporter RNA and its interaction with the U1A-GFP fusion protein is shown on the left. (B) Cells containing no RNA, wt U1A RNA, C22 U1A RNA, and C225 U1A RNA mRNAs in a wt strain. * indicates p < 0.05 for wt U1A mRNA versus C22 and C225 U1A mRNAs. (C) Cells containing wt U1A reporter mRNA in wt, upf1Δ, upf2Δ, and upf3Δ strains. (D) Cells containing C22 U1A reporter mRNA in wt, upf1Δ, upf2Δ, and upf3Δ strains. a indicates p < 0.05 for wt strain versus upf1Δ strain, b indicates p < 0.05 for wt strain versus upf2Δ and upf3Δ strains, and c indicates p < 0.0001 for upf1Δ versus upf2Δ and upf3Δ strains. (E) Cells containing C225 U1A reporter mRNA in wt, upf1Δ, upf2Δ, and upf3Δ strains. * indicates p < 0.05 for wt strain versus upf1Δ, upf2Δ, and upf3Δ strains. Data are represented as mean of three experiments ± SD. Total of 50 cells were analyzed for this quantification.
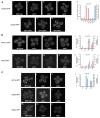
Figure 3. Analysis of Upf Mutants
(A) Top panel (left to right): localization of Dcp2p-GFP in, wt (i), upf1Δ (ii), upf2Δ (iii), and upf3Δ (iv) strains. Bottom panel (left to right): localization of Dcp2p-GFP in upf1Δupf2Δ (v), upf1Δupf3Δ (vi), and upf2Δupf3Δ (vii) strains. (viii) Histogram represents average number of P-bodies/cell (left Y axis) and average area of P-bodies/cell in pixels^2 (right Y axis) for Dcp2p-GFP in wt, upf1Δ, upf2Δ, upf3Δ, upf1Δupf2Δ, upf1Δupf3Δ, and upf2Δupf3Δ strains. a indicates p < 0.0005 for wt strain versus upf2Δ, upf3Δ, and upf2Δupf3Δ strains (for wt strain versus upf1Δ, upf1Δ upf2Δ, and upf1Δupf3Δ strains the P values were high, indicating that they are very similar) and b indicates p < 0.0005 for upf1Δ strain versus upf2Δ, upf3Δ, and upf2Δupf3Δ strains. (B) Top panel (left to right): localization of Dhh1p-GFP in, wt (i), upf1Δ (ii), upf2Δ (iii), and upf3Δ (iv) strains. (v) Histogram represents average number of P-bodies/cell (left Y axis) and average area of P-bodies/cell in pixels^2 (right Y axis) for Dhh1p-GFP in wt, upf1Δ, upf2Δ, and upf3Δ strains. * indicates p < 0.05 for wt strain versus upf2Δ and upf3Δ strains. Bottom panel (left to right): localization of Pat1p-GFP in wt (vi), upf1Δ (vii), upf2Δ (viii), and upf3Δ (ix) strains. (x) Histogram represents average number of P-bodies/cell (left Y axis) and average area of P-bodies/cell in pixels^2 (right Y axis) for Pat1p-GFP in wt, upf1Δ, upf2Δ, and upf3Δ strains. * indicates p < 0.05 for wt strain versus upf2Δ and upf3Δ strains. (C) Top panel: localization of Upf1p-GFP in wt (i), upf2Δ (ii), and upf3Δ (iii) strains. Middle panel: localization of Upf2p-GFP in wt (iv), upf1Δ (v), and upf3Δ (vi) strains. Bottom panel: Localization of Upf3p-GFP in wt (vii), upf1Δ (viii), and upf2Δ (ix) strains. (x) Histogram represents average number of P-bodies/cell (left Y axis) and average area of P-bodies/cell in pixels^2 (right Y axis) for Upf1p-GFP in wt, upf2Δ, and upf3Δ strains. * indicates p < 0.005 for wt strain versus upf2Δ and upf3Δ strains. Data are represented as mean of three experiments ± SD.
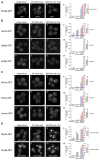
Figure 4. Analysis of the DE572AA upf1 Allele
(A) upf1Δ strain transformed with low-copy plasmid expressing empty vector (pRP415) (i), wt Upf1p (pRP910) (ii), DE572AA upf1 allele (pRP912) (iii). All strains are transformed with plasmid containing Dcp2p-GFP as a marker for P-bodies. (iv) Histogram represents average number of P-bodies/cell (left Y axis) and average area of P-bodies/cell in pixels^2 (right Y axis) for Dcp2p-GFP in upf1Δ strain containing empty vector, wt Upf1p, or DE572AA upf1 allele. * indicates p < 0.005 for vector versus DE572AA upf1 allele. (B) Localization of Upf1p-GFP (top), Upf2p-GFP (middle), Upf3p-GFP (bottom) in wt strain overexpressing empty vector (pRP415) (i, v, ix), or wt Upf1p (pRP913) (ii, vi, x), or DE572AA upf1 allele (pRP915) (iii, vii, xi), respectively. Histograms represent average number of P-bodies/cell (left Y axis) and average area of P-bodies/cell in pixels^2 (right Y axis) for: (iv) Upf1-GFP strain containing empty vector, wt Upf1p, or DE572AA upf1 allele. * indicates p < 0.05 for vector versus wt Upf1p and DE572AA upf1 allele. (viii) Upf2p-GFP strain containing vector, wt Upf1p, or DE572AA upf1 allele. (xii) Upf3p-GFP strain containing vector, wt Upf1p, or DE572AA upf1 allele. (C) Localization of Dhh1p-GFP (top), Pat1p-GFP (middle), Lsm1p-GFP (bottom) in wt strain overexpressing empty vector (i, v, ix), or wt Upf1p (ii, vi, x), or DE572AA upf1 allele (iii, vii, xi). Histograms represent average number of P-bodies/cell (left Y axis) and average area of P-bodies/cell in pixels^2 (right Y axis) for: (iv) Dhh1p-GFP strain containing empty vector, wt Upf1p, or DE572AA upf1 allele. * indicates p < 0.0001 for vector versus DE572AA upf1 allele. (viii) Pat1p-GFP strain containing empty vector, wt Upf1p, or DE572AA upf1 allele. * indicates p < 0.0001 for vector versus DE572AA upf1 allele. (xii) Lsm1p-GFP strain containing empty vector, wt Upf1p, or DE572AA upf1 allele. * indicates p < 0.0001 for vector versus DE572AA upf1 allele. (D) Localization of Dcp2p-GFP in upf1Δupf2Δ strain (top) or in upf1Δupf3Δ strain (bottom) overexpressing empty vector (i, v), or wt Upf1p (ii, vi), or DE572AA upf1 allele (iii, vii). Histograms represent average number of P-bodies/cell (left Y axis) and average area of P-bodies/cell in pixels^2 (right Y axis) for: (iv) Dcp2p-GFP in upf1Δupf2Δ strain containing empty vector, wt Upf1p, or DE572AA upf1 allele. * indicates p < 0.005 for vector versus DE572AA upf1 allele. (viii) Dcp2p-GFP in upf1Δupf3Δ strain containing empty vector, wt Upf1p, or DE572AA upf1 allele. * indicates p < 0.05 for vector versus DE572AA upf1 allele. Data are represented as mean of three experiments ± SD.
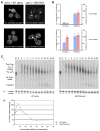
Figure 5. ATPase Activity of Upf1p Is Not Required for Targeting of mRNAs to P-Bodies
(A) Localizing wt U1A RNA (top) or C22 U1A RNA (bottom) in upf1Δ strain transformed with low copy plasmid expressing wt Upflp (left panel) or DE572AA upf1 allele (right panel). (B) Histograms represent average number of P-bodies/cell (left Y axis) and average area of P-bodies/cell in pixels^2 (right Y axis) for: Top panel: wt U1A RNA in upf1Δ strain expressing either wt Upflp or DE572AA upf1 allele. * indicates p < 0.05 for wt Upflp versus DE572AA upf1 allele. Bottom panel: C22 U1A RNA in upf1Δ strain expressing either wt Upflp or DE572AA upf1 allele. * indicates p < 0.05 for wt Upflp versus DE572AA upf1 allele. Data are represented as mean of three experiments ± SD. Total of 50 cells were analyzed for this quantification. (C) (i) Transcriptional pulse-chase of wt PGK1 mRNA in upf1Δ strain expressing wt Upflp (left panel) or DE572AA upf1 allele (right panel). Plasmid pRP469 was introduced into the strains by transformation and transcriptional pulse-chase performed as previously described (Decker and Parker, 1993). (ii) shows the loading control using the oligo (oRP100) for the 7S RNA. (iii) Graph showing the decay profile for wt PGK1 mRNA in upf1Δ strain expressing wt Upflp (blue) or DE572AA upf1 allele (pink).
Figure 6. Overexpression of DE572AA upf1 Allele Causes Translational Repression, an Increase in P-Bodies, and Inhibition of Growth
Polysome profiles (i, sucrose in red and galactose in gray), P-body accumulation (ii and iii), and growth assays (iv and v) in wt strain expressing empty vector (A), or overexpressing wt Upf1p (B), or overexpressing DE572AA upf1 allele (C). All the polysome profiles were obtained using UV monitor Uvicord SII, Pharmacia at 254 nm wavelength and 0.5AUFS sensitivity. P-bodies were visualized using Dcp2p-GFP.
Figure 7
A Model for the Process of Nonsense-Mediated Decay
Comment in
- P-bodies react to stress and nonsense.
Bruno I, Wilkinson MF. Bruno I, et al. Cell. 2006 Jun 16;125(6):1036-8. doi: 10.1016/j.cell.2006.06.003. Cell. 2006. PMID: 16777595
Similar articles
- P-bodies react to stress and nonsense.
Bruno I, Wilkinson MF. Bruno I, et al. Cell. 2006 Jun 16;125(6):1036-8. doi: 10.1016/j.cell.2006.06.003. Cell. 2006. PMID: 16777595 - Inactivation of NMD increases viability of sup45 nonsense mutants in Saccharomyces cerevisiae.
Chabelskaya S, Gryzina V, Moskalenko S, Le Goff C, Zhouravleva G. Chabelskaya S, et al. BMC Mol Biol. 2007 Aug 16;8:71. doi: 10.1186/1471-2199-8-71. BMC Mol Biol. 2007. PMID: 17705828 Free PMC article. - Nonsense-containing mRNAs that accumulate in the absence of a functional nonsense-mediated mRNA decay pathway are destabilized rapidly upon its restitution.
Maderazo AB, Belk JP, He F, Jacobson A. Maderazo AB, et al. Mol Cell Biol. 2003 Feb;23(3):842-51. doi: 10.1128/MCB.23.3.842-851.2003. Mol Cell Biol. 2003. PMID: 12529390 Free PMC article. - UPF1 P-body localization.
Brogna S, Ramanathan P, Wen J. Brogna S, et al. Biochem Soc Trans. 2008 Aug;36(Pt 4):698-700. doi: 10.1042/BST0360698. Biochem Soc Trans. 2008. PMID: 18631143 Review. - NMD monitors translational fidelity 24/7.
Celik A, He F, Jacobson A. Celik A, et al. Curr Genet. 2017 Dec;63(6):1007-1010. doi: 10.1007/s00294-017-0709-4. Epub 2017 May 23. Curr Genet. 2017. PMID: 28536849 Free PMC article. Review.
Cited by
- Relationship of GW/P-bodies with stress granules.
Stoecklin G, Kedersha N. Stoecklin G, et al. Adv Exp Med Biol. 2013;768:197-211. doi: 10.1007/978-1-4614-5107-5_12. Adv Exp Med Biol. 2013. PMID: 23224972 Free PMC article. Review. - GW body disassembly triggered by siRNAs independently of their silencing activity.
Serman A, Le Roy F, Aigueperse C, Kress M, Dautry F, Weil D. Serman A, et al. Nucleic Acids Res. 2007;35(14):4715-27. doi: 10.1093/nar/gkm491. Epub 2007 Jun 29. Nucleic Acids Res. 2007. PMID: 17604308 Free PMC article. - P-body formation is a consequence, not the cause, of RNA-mediated gene silencing.
Eulalio A, Behm-Ansmant I, Schweizer D, Izaurralde E. Eulalio A, et al. Mol Cell Biol. 2007 Jun;27(11):3970-81. doi: 10.1128/MCB.00128-07. Epub 2007 Apr 2. Mol Cell Biol. 2007. PMID: 17403906 Free PMC article. - Control of Translation at the Initiation Phase During Glucose Starvation in Yeast.
Janapala Y, Preiss T, Shirokikh NE. Janapala Y, et al. Int J Mol Sci. 2019 Aug 19;20(16):4043. doi: 10.3390/ijms20164043. Int J Mol Sci. 2019. PMID: 31430885 Free PMC article. Review. - Arabidopsis thaliana XRN2 is required for primary cleavage in the pre-ribosomal RNA.
Zakrzewska-Placzek M, Souret FF, Sobczyk GJ, Green PJ, Kufel J. Zakrzewska-Placzek M, et al. Nucleic Acids Res. 2010 Jul;38(13):4487-502. doi: 10.1093/nar/gkq172. Epub 2010 Mar 24. Nucleic Acids Res. 2010. PMID: 20338880 Free PMC article.
References
- Abramoff MD, Magelhaes PJ, Ram SJ. Image processing with ImageJ. Biophotonics International. 2004;11:36–42.
- Amrani N, Ganesan R, Kervestin S, Mangus DA, Ghosh S, Jacobson A. A faux 3[prime]-UTR promotes aberrant termination and triggers nonsense-mediated mRNA decay. Nature. 2004;432:112–118. - PubMed
- Baker KE, Parker R. Nonsense-mediated mRNA decay: terminating erroneous gene expression. Curr Opin Cell Biol. 2004;16:293–299. - PubMed
Publication types
MeSH terms
Substances
LinkOut - more resources
Full Text Sources
Other Literature Sources
Molecular Biology Databases


