Status of complete proteome analysis by mass spectrometry: SILAC labeled yeast as a model system - PubMed (original) (raw)
Status of complete proteome analysis by mass spectrometry: SILAC labeled yeast as a model system
Lyris M F de Godoy et al. Genome Biol. 2006.
Abstract
Background: Mass spectrometry has become a powerful tool for the analysis of large numbers of proteins in complex samples, enabling much of proteomics. Due to various analytical challenges, so far no proteome has been sequenced completely. O'Shea, Weissman and co-workers have recently determined the copy number of yeast proteins, making this proteome an excellent model system to study factors affecting coverage.
Results: To probe the yeast proteome in depth and determine factors currently preventing complete analysis, we grew yeast cells, extracted proteins and separated them by one-dimensional gel electrophoresis. Peptides resulting from trypsin digestion were analyzed by liquid chromatography mass spectrometry on a linear ion trap-Fourier transform mass spectrometer with very high mass accuracy and sequencing speed. We achieved unambiguous identification of more than 2,000 proteins, including very low abundant ones. Effective dynamic range was limited to about 1,000 and effective sensitivity to about 500 femtomoles, far from the subfemtomole sensitivity possible with single proteins. We used SILAC (stable isotope labeling by amino acids in cell culture) to generate one-to-one pairs of true peptide signals and investigated if sensitivity, sequencing speed or dynamic range were limiting the analysis.
Conclusion: Advanced mass spectrometry methods can unambiguously identify more than 2,000 proteins in a single proteome. Complex mixture analysis is not limited by sensitivity but by a combination of dynamic range (high abundance peptides preventing sequencing of low abundance ones) and by effective sequencing speed. Substantially increased coverage of the yeast proteome appears feasible with further development in software and instrumentation.
Figures
Figure 1
An overview of previous large-scale studies identifying yeast proteins. The studies using a combination of two-dimensional gel electrophoresis and mass spectrometry (2DE) are Shevchenko et al. [13], Garrels et al. [42] and Perrot et al. [43]. Experiments using only MS or 1D PAGE and MS (LC/MS) are Washburn et al. [14], Peng et al. [15] and Wei et al. [16]. The Wei et al. study is colored in grey and has a question mark because no data were provided on the identifications, making it difficult to evaluate the claim of 3,019 identified proteins, especially as low resolution mass spectrometry was employed.
Figure 2
Work flow of the yeast proteomics experiment.
Figure 3
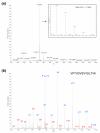
Example of MS and MS/MS on the LTQ-FT. (a) A mass spectrum of yeast peptides eluting from the column at a particular time point in the LC gradient and electrosprayed into the LTQ-FT mass spectrometer. The inset is a zoom of the doubly charged peptide ion at m/z 735.929, showing its natural isotope distribution and demonstrating very high resolution. (b) Tandem mass spectrum of the dominant peptide in (a). Peptides fragment on average once at different amide bonds, giving rise to carboxy-terminal containing y-ions or amino-terminal containing b-ions. The prominent y13++ ion is caused by fragmentation at the first amide bond, which is favored here because it is amino-terminal to proline. (See [44] for an introduction to peptide sequencing and identification by MS.) The mass of the peptide identified is within less than 1 ppm of the calculated value.
Figure 4
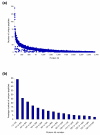
Number of peptides identifying yeast proteins. (a) Unique peptides with score of at least 15 and mass accuracy at least 10 ppm. Proteins are ordered by decreasing Mascot score. (b) Average number of unique peptides identifying proteins in bins of 100. Only peptides from verified protein hits with at least two peptides are plotted.
Figure 5
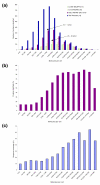
Protein abundance in the yeast proteome and identification by mass spectrometry. (a) Blue bars indicate the number of yeast proteins in copy number classes (recalculated from the data in Ghaemmaghami et al. [17]). Red bars represent the proteins identified in each copy number class in this study, green bars represent the data from Washburn et al. [14] and yellow bars data from Peng et al. [15]. The arrow labeled 0.5-1 pmol points to the bin with a 50% chance of identification (this data) whereas the arrow labeled 20-40 pmol indicates the amount and copy number needed for a 50% chance of identification by the Washburn et al. and Peng et al. studies. (b) Data of this study normalized to the number of proteins detected by western blotting in each copy number class. (c) Percentage of the total protein sequence covered by identified peptides as an average for the abundance bin. Sequence coverage for each protein is calculated in Additional data file 1.
Figure 6
Parameters affecting the degree of proteome coverage. The dark blue terms pertain to the characteristics of the mass spectrometer and associated on-line chromatography. In red are the corresponding characteristics of the proteome. The blue arrows indicate that the three parameters are interdependent. For example, limited dynamic range and sequencing speed act together to reduce the effective sensitivity in complex mixtures to below that of single proteins.
Figure 7
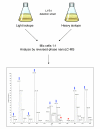
SILAC labeling of yeast to recognize true peptide signals. A yeast strain that is deficient for lysine biosynthesis is grown in the presence of normal lysine or lysine with substituted 13C and 15N, leading to a mass difference of 8 Da. Yeast cells are mixed in equal proportions, lysed, digested by endopeptidase LysC and analyzed by mass spectrometry. In the example mass spectrum, each true peptide signal is represented by a pair, spaced by 8 Da (blue arrows; mass difference appear different because peptide can have different charge states). Peaks marked by red stars are unlikely to be yeast peptides because they have no SILAC partner.
Figure 8
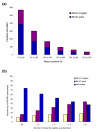
Degree of sampling of SILAC peptide pairs. Yeast was SILAC labeled as explained in Figure 7 and one gel band was analyzed. In principle, SILAC peptide pairs should both be recognized and sequenced as they are equally abundant. (a) Proteins identified were binned according to decreasing Mascot score. Blue bars indicate the peptide in which both members of SILAC pairs were sequenced and red bars indicate the proportion of peptides in which only one member of the SILAC pair was sequenced. (b) Complete analysis of the LCMS experiment for all SILAC pairs extracted by their mass differences. Peptide pairs are ordered by the number of consecutive mass spectrometry scans that they appear in, thus greater or equal than three means that the pair was detected in three or more scans.
Similar articles
- System-wide perturbation analysis with nearly complete coverage of the yeast proteome by single-shot ultra HPLC runs on a bench top Orbitrap.
Nagaraj N, Kulak NA, Cox J, Neuhauser N, Mayr K, Hoerning O, Vorm O, Mann M. Nagaraj N, et al. Mol Cell Proteomics. 2012 Mar;11(3):M111.013722. doi: 10.1074/mcp.M111.013722. Epub 2011 Oct 20. Mol Cell Proteomics. 2012. PMID: 22021278 Free PMC article. - Comprehensive mass-spectrometry-based proteome quantification of haploid versus diploid yeast.
de Godoy LM, Olsen JV, Cox J, Nielsen ML, Hubner NC, Fröhlich F, Walther TC, Mann M. de Godoy LM, et al. Nature. 2008 Oct 30;455(7217):1251-4. doi: 10.1038/nature07341. Epub 2008 Sep 28. Nature. 2008. PMID: 18820680 - Deglycosylation systematically improves N-glycoprotein identification in liquid chromatography-tandem mass spectrometry proteomics for analysis of cell wall stress responses in Saccharomyces cerevisiae lacking Alg3p.
Bailey UM, Schulz BL. Bailey UM, et al. J Chromatogr B Analyt Technol Biomed Life Sci. 2013 Apr 1;923-924:16-21. doi: 10.1016/j.jchromb.2013.01.026. Epub 2013 Feb 4. J Chromatogr B Analyt Technol Biomed Life Sci. 2013. PMID: 23454304 - Development and application of proteomics technologies in Saccharomyces cerevisiae.
Kolkman A, Slijper M, Heck AJ. Kolkman A, et al. Trends Biotechnol. 2005 Dec;23(12):598-604. doi: 10.1016/j.tibtech.2005.09.004. Epub 2005 Oct 3. Trends Biotechnol. 2005. PMID: 16202464 Review. - The use of accurate mass tags for high-throughput microbial proteomics.
Smith RD, Anderson GA, Lipton MS, Masselon C, Pasa-Tolic L, Shen Y, Udseth HR. Smith RD, et al. OMICS. 2002;6(1):61-90. doi: 10.1089/15362310252780843. OMICS. 2002. PMID: 11881835 Review.
Cited by
- Mass recalibration of FT-ICR mass spectrometry imaging data using the average frequency shift of ambient ions.
Barry JA, Robichaud G, Muddiman DC. Barry JA, et al. J Am Soc Mass Spectrom. 2013 Jul;24(7):1137-45. doi: 10.1007/s13361-013-0659-0. Epub 2013 May 29. J Am Soc Mass Spectrom. 2013. PMID: 23715870 Free PMC article. - Testicular postgenomics: targeting the regulation of spermatogenesis.
Calvel P, Rolland AD, Jégou B, Pineau C. Calvel P, et al. Philos Trans R Soc Lond B Biol Sci. 2010 May 27;365(1546):1481-500. doi: 10.1098/rstb.2009.0294. Philos Trans R Soc Lond B Biol Sci. 2010. PMID: 20403865 Free PMC article. Review. - Protein and gene model inference based on statistical modeling in k-partite graphs.
Gerster S, Qeli E, Ahrens CH, Bühlmann P. Gerster S, et al. Proc Natl Acad Sci U S A. 2010 Jul 6;107(27):12101-6. doi: 10.1073/pnas.0907654107. Epub 2010 Jun 18. Proc Natl Acad Sci U S A. 2010. PMID: 20562346 Free PMC article. - Mining gene functional networks to improve mass-spectrometry-based protein identification.
Ramakrishnan SR, Vogel C, Kwon T, Penalva LO, Marcotte EM, Miranker DP. Ramakrishnan SR, et al. Bioinformatics. 2009 Nov 15;25(22):2955-61. doi: 10.1093/bioinformatics/btp461. Epub 2009 Jul 24. Bioinformatics. 2009. PMID: 19633097 Free PMC article. - Phosphoproteomics by mass spectrometry: insights, implications, applications and limitations.
Mayya V, Han DK. Mayya V, et al. Expert Rev Proteomics. 2009 Dec;6(6):605-18. doi: 10.1586/epr.09.84. Expert Rev Proteomics. 2009. PMID: 19929607 Free PMC article.
References
Publication types
MeSH terms
Substances
LinkOut - more resources
Full Text Sources
Other Literature Sources
Molecular Biology Databases


